Africa Graph Indicates Financial Report And Analysis
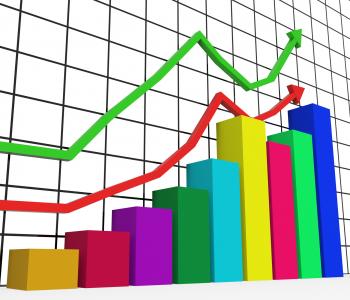
Graph Increasing Indicates Growth Statistics And Increase
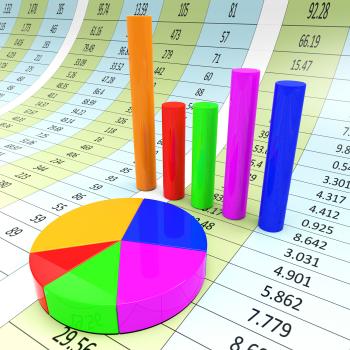
Blue Bar Chart Shows Increased Profit
Raising Stocks Chart Shows Monetary Growth
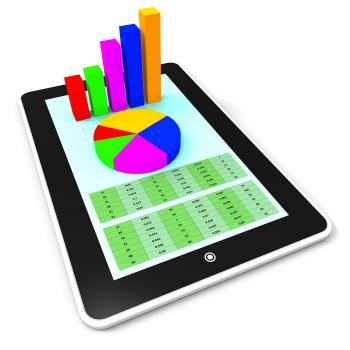
Online Report Represents World Wide Web And Computing
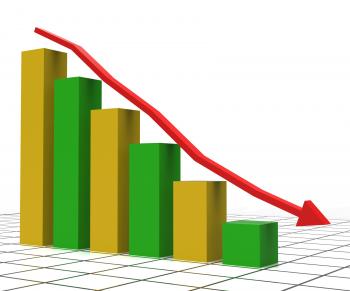
Decreasing Report Shows Graphic Analysis And Graphs
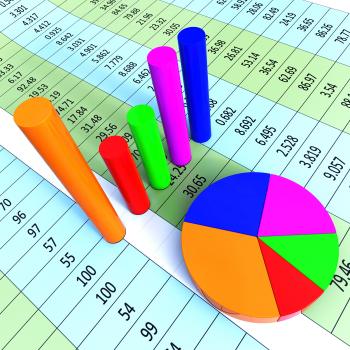
Graph Report Represents Trade Corporate And Finance
Growth File Represents Business Graph And Binder 3d Rendering
Business Report Shows Financial Infochart And Graphs
Taxes Chart Graph Displays Increasing Tax Or Taxation
Target Report Represents Business Graph And Analysis
Increase Revenue Represents Business Graph And Advancing
Improve Graph Indicates Improvement Plan And Data
Pie Chart Report Means Data Reports And Graph
Microchip
Plan B Diagram Displays Substitute Or Alternative
Budget Graph Negative Shows Budgeting Decline 3d Rendering
Flow Diagram Represents Charting Organizations And Graph
Blank Diagram Blackboard Shows Business Plan Arrows Flow Chart
Pie Chart And 3d Characters Represents Statistics Report
Business Diagram Displays Plan Team And Investment
Cancer Graph Indicates Cancerous Growth And Diagram
Property Report Indicates Business Graph And House
Quality Diagram Means Grade State Or Condition
Online Marketing Diagram Showing Blogs Websites Social Media And Email
Data Graphs Means Statistical Diagram And Bytes
Finance Diagram Shows Credit Equity And Margin
Business Diagram Means Company Venture Or Commerce
Meditation Diagram Means Relaxation Calm And Peace
Debt Businessman Shows Lack Of Success And Accounting 3d Rendering
Graph Report Indicates Diagram Charts And Analysis
Quality Diagram Displays Grade State Or Condition
Revenues Charts Represents Business Graph And Salary
Business Diagram Means Plan Team And Investment
Graph Report Shows Infograph Finance And Graphic
Debt Graph Chart Displays Increasing Financial Indebted
Education Diagram Displays Aptitude Knowledge And Improving
SEO Chart Graph Shows Increase Search Engine Optimization
Blue Percentage Symbol Shows Reduced Price
Big Discount Indicates Cut Rate And Data
Entrepreneur Diagram Shows Business Person And Start-Up
Prices Increase Represents Financial Report And Diagram
Blank Output Diagram Shows Schematic Plan Outflow Chart
Career Diagram Means Profession And Field Of Work
Designs Blocks Mean to Design Create and to Diagram
Graph On Screen Shows Increase Sales Achievement
Pie Chart Report Represents Business Graph And Diagram
Reports Dice Represent Reported Information or Articles
Spending Chart Graph Shows Increasing Expenditure Purchasing
Pie Chart Report Indicates Business Graph And Document
Data Charts Indicates Business Graph And Bytes
Pie Chart Indicates Financial Report And Charts
Graph Report Shows Graphs Charts And Infochart
Infographic Computer Indicates Infographics Online And Statistics
Riches Chart Graph Shows Increase Cash Wealth Revenue
Life Balance Diagram Showing Family Career Health And Friends
Pie Chart Indicates Stat Graphics And Infochart
Review Diagram Means Examine Evaluate And Survey
Profits Graph Shows Earn Investment And Diagram
Earnings Graph Negative Indicates Wage Crisis 3d Rendering
Investment Charts Shows Business Graph And Forecast
Two Year Plan Arrows Means Program For Next 2 Years
Business Graph Indicates Diagram Infochart And Profit
Risk Graph Shows Infochart Beware And Risky
Business Strategy Pyramid Showing Teamwork And Plan
Consultant Diagram Shows Expert With Opinions And Solutions
Graph Increasing Shows Financial Report And Advance
Bonus Chart Graph Displays Increase Reward Or Perk
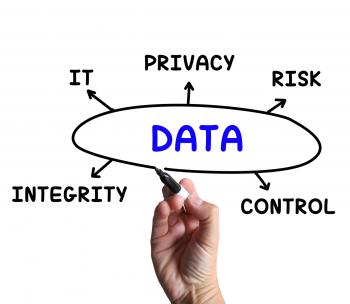
Data Diagram Means IT Control And Risk
Decisions Diagram Means Reports And Deciding On Products
Site Map Arrows Means Navigating Around Website
Feedback Diagram Shows Judgement Critics And Opinion
Budget Graph Means Costing Expenditure And Statistic
Supply Sphere Definition Shows Goods Provision Or Product Demand
Feedback Diagram Means Survey Reports And Opinion
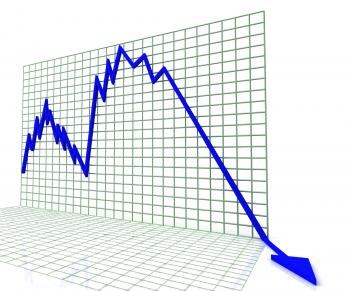
Downturn Graph Represents Market Chart And Loss 3d Rendering
Graph Earn Represents Graphics Salaries And Income
Cash Flow Graph Represents Investment Earn And Wage
Training Diagram Shows Workshops Groundwork And Educating
Economy Graph Indicates Micro Economics And Charts
Investment Guide Indicates Business Graph And Advise
Business Strategy Diagram Showing Teamwork And Planning
Internet Laptop Means Searching Social Networks Blogging And Online Co
Salary Chart Graph Displays Increase Earn Cash Wealth Revenue
Financial Charts Shows Business Graph And Banking
Reputation Diagram Means Credibility Honor And Integrity
Sales Chart Graph Displays Increasing Profits Trade
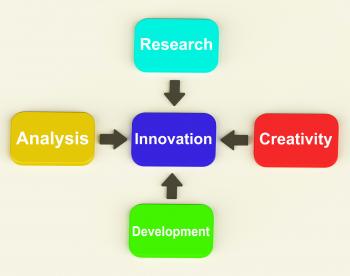
Innovation Diagram Means Creativity Researching Analysing And Developm
Credit Graph Chart Displays Buy Increase Grow Debt
Progress Arrows Represents Business Graph And Advance
Feedback Diagram Means Opinion Judging And View
Improve Economy Shows Business Graph And Advance
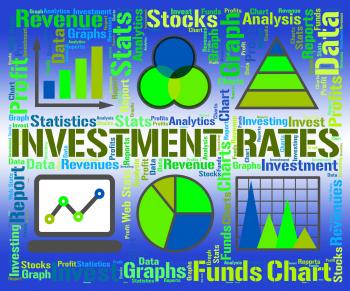
Investment Rates Represents Invested Percent And Percentage
Business Graph Means Infochart Diagram And Statistic
Commerce Diagram Displays Marketing Sales And Profit
Market Research Diagram Displays Researching Consumer Demand And Prefe
Earn Graph Chart Shows Increase Earnings Growing
Blue Graph Shows Sales Or Profit
Business Arrows Means Company Venture Or Commerce