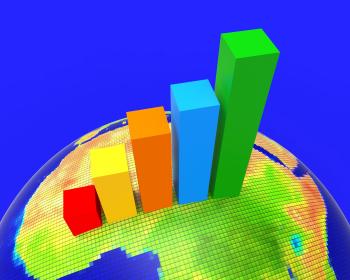
Africa Graph Indicates Financial Report And Analysis
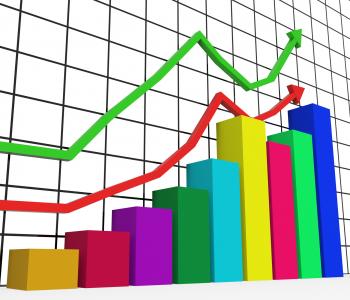
Graph Increasing Indicates Growth Statistics And Increase
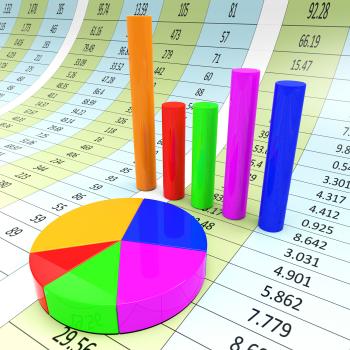
Blue Bar Chart Shows Increased Profit
Raising Stocks Chart Shows Monetary Growth
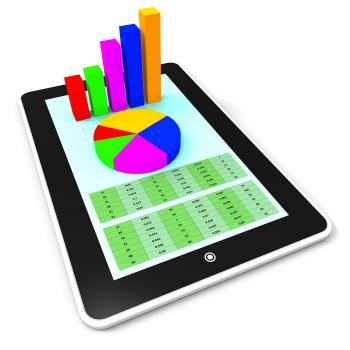
Online Report Represents World Wide Web And Computing
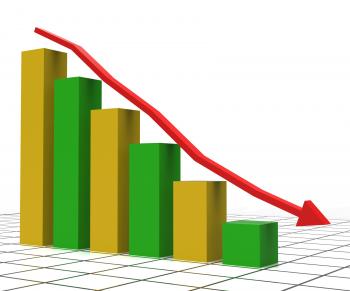
Decreasing Report Shows Graphic Analysis And Graphs
Graph Report Represents Trade Corporate And Finance
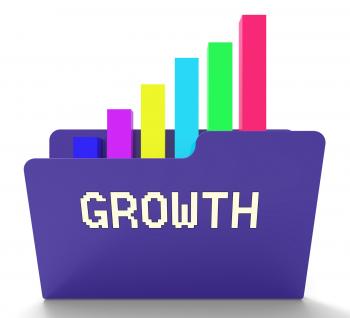
Growth File Represents Business Graph And Binder 3d Rendering
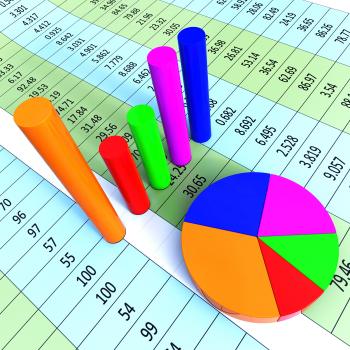
Business Report Shows Financial Infochart And Graphs
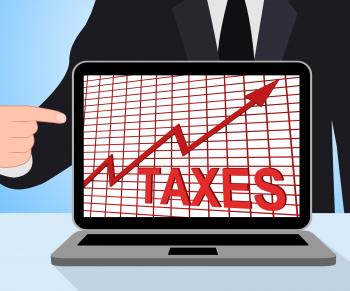
Taxes Chart Graph Displays Increasing Tax Or Taxation
Target Report Represents Business Graph And Analysis
Increase Revenue Represents Business Graph And Advancing
Improve Graph Indicates Improvement Plan And Data
Pie Chart Report Means Data Reports And Graph
Microchip
Plan B Diagram Displays Substitute Or Alternative
Budget Graph Negative Shows Budgeting Decline 3d Rendering
Flow Diagram Represents Charting Organizations And Graph
Blank Diagram Blackboard Shows Business Plan Arrows Flow Chart
Pie Chart And 3d Characters Represents Statistics Report
Business Diagram Displays Plan Team And Investment
Cancer Graph Indicates Cancerous Growth And Diagram
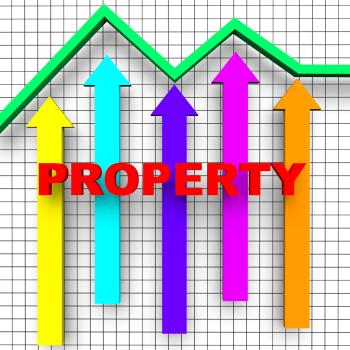
Property Report Indicates Business Graph And House
Quality Diagram Means Grade State Or Condition
Online Marketing Diagram Showing Blogs Websites Social Media And Email
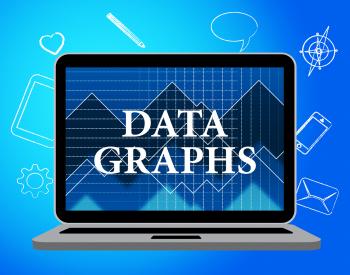
Data Graphs Means Statistical Diagram And Bytes
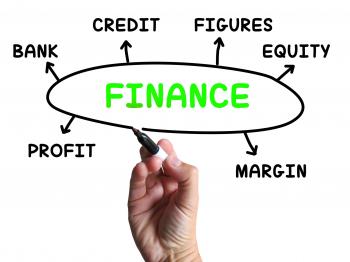
Finance Diagram Shows Credit Equity And Margin
Business Diagram Means Company Venture Or Commerce
Meditation Diagram Means Relaxation Calm And Peace
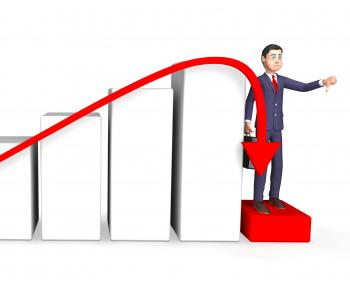
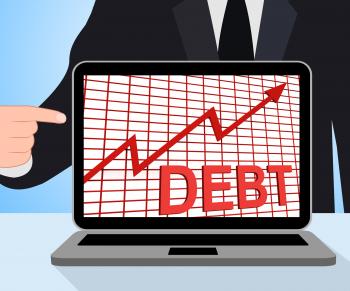
Debt Businessman Shows Lack Of Success And Accounting 3d Rendering
Graph Report Indicates Diagram Charts And Analysis
Quality Diagram Displays Grade State Or Condition
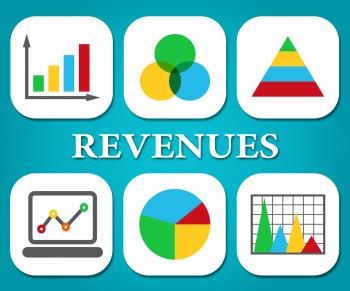
Revenues Charts Represents Business Graph And Salary
Business Diagram Means Plan Team And Investment
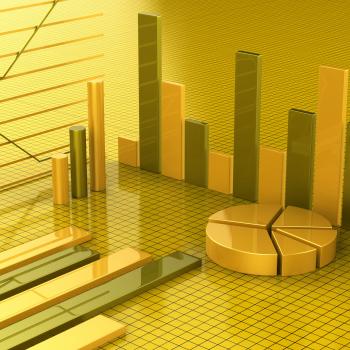
Graph Report Shows Infograph Finance And Graphic
Debt Graph Chart Displays Increasing Financial Indebted