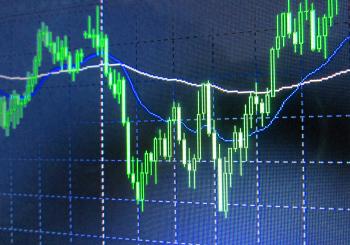
Stock market graph
Formula on blackboard
Painted Lightbulb - Creativity and Imagination Concept - Abstract
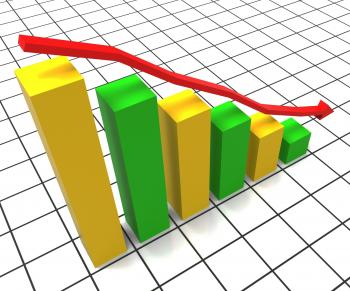
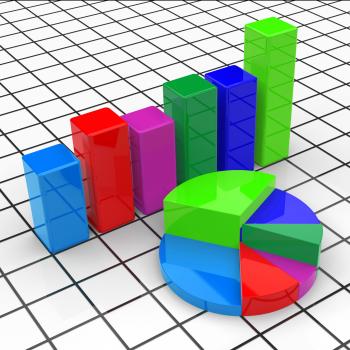
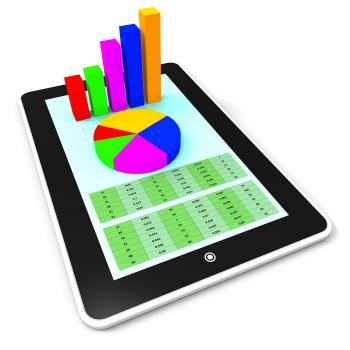
3D Chart
Graph Increasing Indicates Growth Statistics And Increase
Increase Revenue Represents Business Graph And Advancing
Improve Graph Indicates Improvement Plan And Data
Big Data Analytics
Target Report Represents Business Graph And Analysis
Business meeting and teamwork - Large team at the table
Graph Increasing Means Statistics Infochart And Investment
Percent Sign With 3d Man Climbing Showing Percentage
Juggling Percent Sign With 3d Man Climbing Showing Percentage
Business meeting and teamwork concept
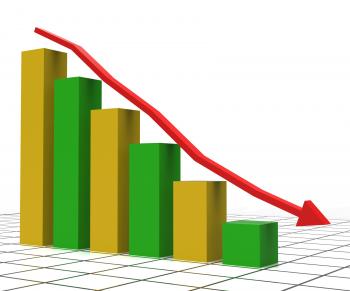
Decreasing Report Represents Business Graph And Decrease
Stock Market Chart
Businessman going downhill - Market crash and correction concept
Macbook Pro Beside Papers
The Big Data Deluge
Big Data Analysis Abstract Concept - Light Version
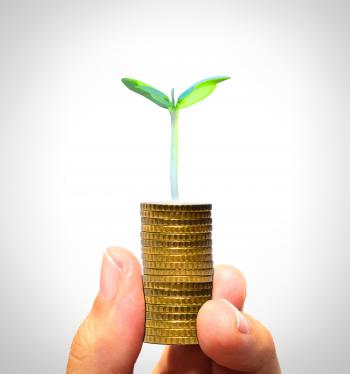
Businessman holding plant sprouting from a handful of golden coins
Decreasing Report Shows Graphic Analysis And Graphs
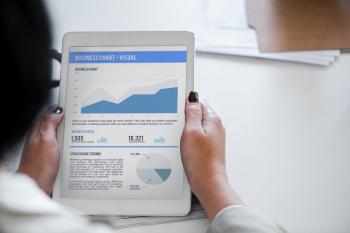
Person Holding White Ipad
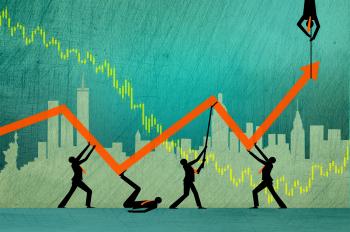
Businessman riding an arrow - Success and finance concept
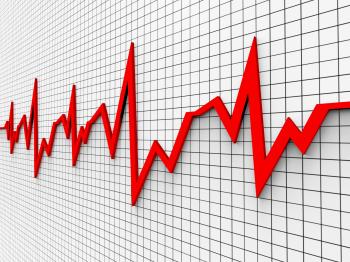
Heartbeat Chart Shows Flat Screen And Cardiograph
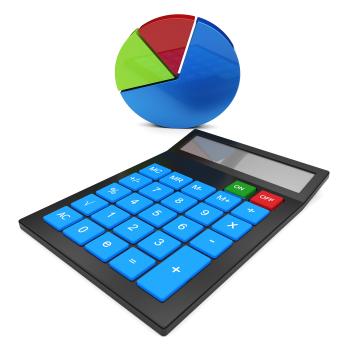
Pie Graph Illustration
Finance Professional - Broker - Financial Advisor - Analyst
Scientific calculator
Web Analytics - From Raw Data to Target
Cute Little Girl Showing Thumbs Up - Creativity and Great Ideas
Businessman drawing an arrow over stack of coins
Money and financial assets growth concept
Businessman looking for financial success
Random Numbers
The search for profit when markets are volatile
World map made of US cent coins
Graph Increasing Shows Financial Report And Advance
Web analytics concept with data icons
Cute Little Girl Raising Finger
Web analytics concept - Multicolor version
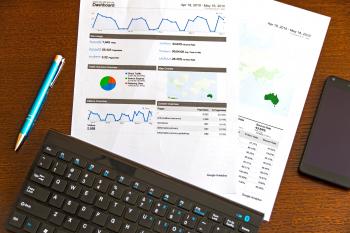
Analyst Working on Laptop
Social media and marketing campaign concept
Hand placing coins on a coin stack with upward arrow
Analyzing histogram with magnifying glass
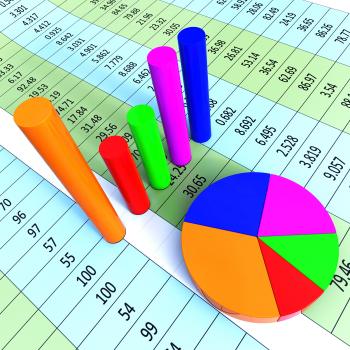
Analytics Charts Represents Business Graph And Statistics
Macbook Pro Beside Spiral Notebook
Big Data Analysis - Abstract Concept
Finance Professional - Broker - Financial Advisor
Businessman drawing a financial graph
Project Management - Budget Planning - Illustration
Sending E-Mail - Electronic Mail Communication
Exports Increasing Shows International Selling And Exportation
Blank Paper And Calculator Shows Calculating Copyspace Statistics
Euros and British Pounds - Finance Concept - Brexit
Statistics and Trends - Upward Trend - Abstract Image
Network - Cloud Computing
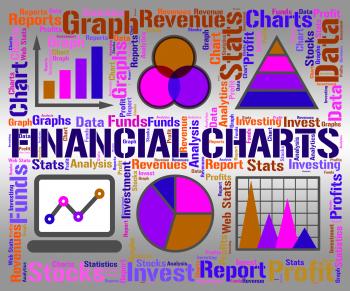
Financial Charts Shows Business Graph And Banking
The wealthy and the others
Close-up of Computer Screen
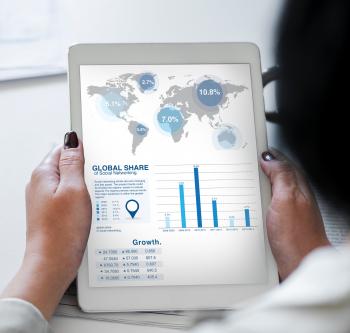
Turned-on White Tablet Computer at Globe Share Graph
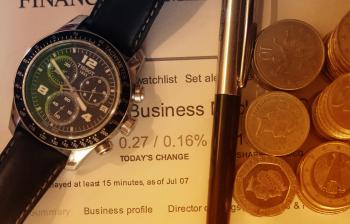
Euros and British Pounds - Finance Concept with Watch - Brexit
Analyzing a Pie Chart
Pie Chart Indicates Stat Graphics And Infochart
Black and Grey Casio Scientific Calculator Showing Formula
Pen on paper with red arrows - Office work concept
Statistics and Figures - Data Analytics Concept
Pie Chart And 3d Characters Represents Statistics Report
Online content marketing and web analytics concept
Pen on paper with blue arrows - Office work concept
Market Research and Marketing Strategy Concept
Improve Economy Shows Business Graph And Advance
Top-view Photography of Smartphones and Papers on White Surface
Concept of Search Engine Optimization with SEO icons
Business and Finance Concept - Business Word on Financial Newspaper
Businessman With Pen Over Financial Data
Graph Report Shows Infograph Finance And Graphic
Prices Increase Represents Financial Report And Diagram
ata Analytics Concept
Person Holding Black and Grey Pen
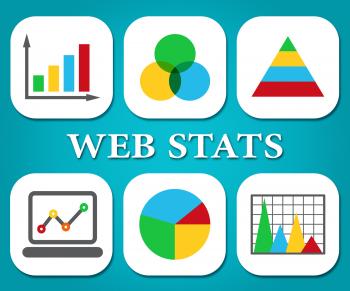
Web Stats Indicates Business Graph And Analysing
Person Writing On Notebook
Money - Euros and British Pounds - Financial Markets Concept with Watc
Success Graph Means Winner Resolution And Winning
Pie Chart Report Represents Business Graph And Diagram
Online Report Represents World Wide Web And Computing
Blue Click Pen Near White Document Papers on Top of Brown Wooden Table
Calculate Statistics Shows Calculated Data And Statistical
Graph Report Represents Trade Corporate And Finance