Medical Human Body Scan - Man and Technology
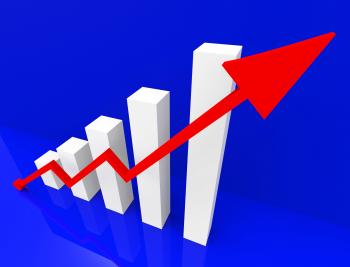
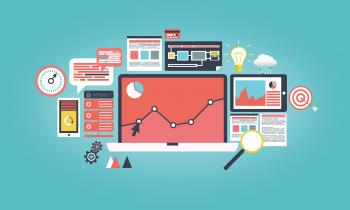
Improve Graph Indicates Improvement Plan And Data
Businessman holding a globe with information technology icons
Businessman holding a ball with information technology icons
Target Report Represents Business Graph And Analysis
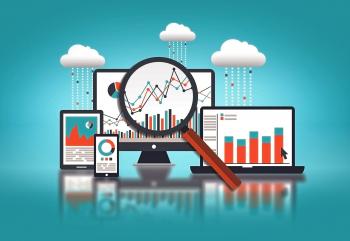
Big Data Analytics and Research - Dark Background
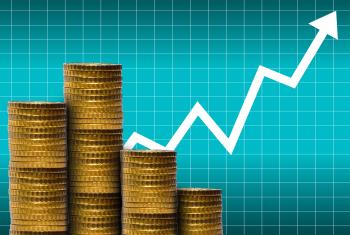
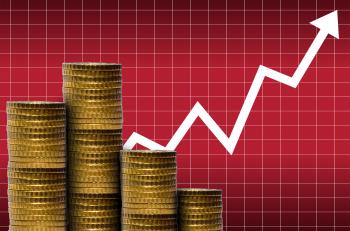
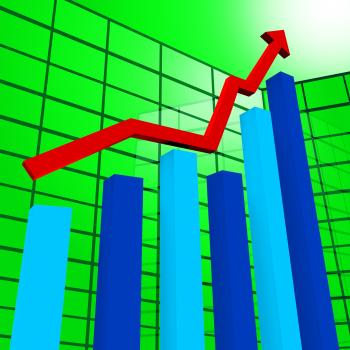
Graph Increasing Means Statistics Infochart And Investment
Big Data Analysis and Research - Concept with Mesh
Statistics and Science with Data Set Analysis - Abstract Illustration
The Stock Market Game - Bulls and Bears
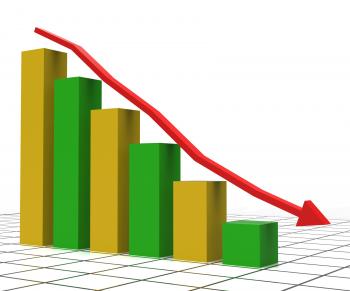
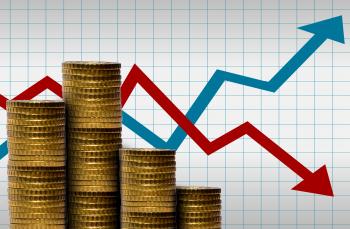
Decreasing Report Represents Business Graph And Decrease
Artificial Intelligence Concept with Virtual Brain
Concept of Intelligence with Human Brain on Blue Background
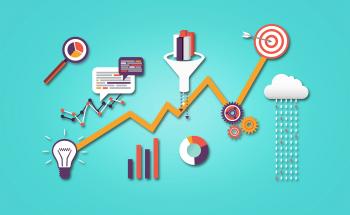
Businessman with bar chart and lightbult - Asset Growth Concept
The Big Data Deluge
Businessman holding plant sprouting from a handful of golden coins
Decreasing Report Shows Graphic Analysis And Graphs
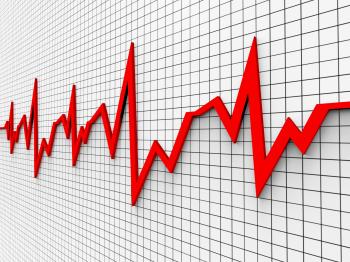
Heartbeat Chart Shows Flat Screen And Cardiograph
Businessman and Bar Chart with Arrow - Money Growth Concept
Businessman drawing an arrow over stack of coins
Money and financial assets growth concept
Money in a pile of coins with financial graph
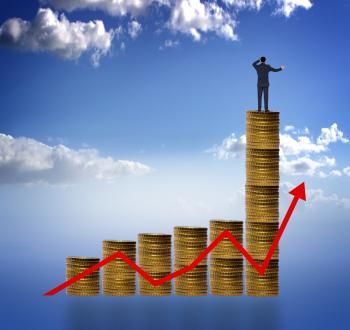
Businessman looking for financial success
Simple Digital Cloud Concept
Binary Map on Abstract Background - Financial Data Concept
Capital Appreciation - Businessmen on Bar Chart with Arrow
Business and Financial Research Reports and Statistics - Concept
Graph Increasing Shows Financial Report And Advance
Web analytics concept with data icons
Web analytics concept - Multicolor version
Analyst Working on Laptop
Hand placing coins on a coin stack with upward arrow
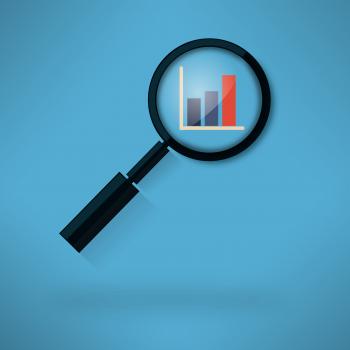
Analyzing histogram with magnifying glass
Analytics Charts Represents Business Graph And Statistics
Exports Increasing Shows International Selling And Exportation
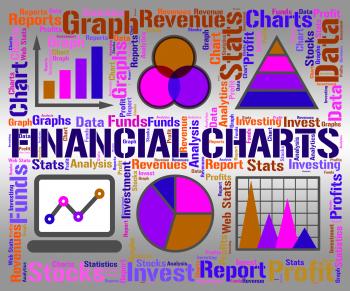
Financial Charts Shows Business Graph And Banking
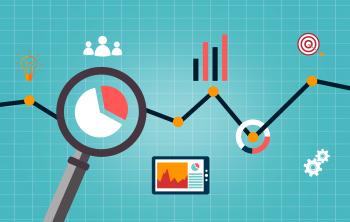
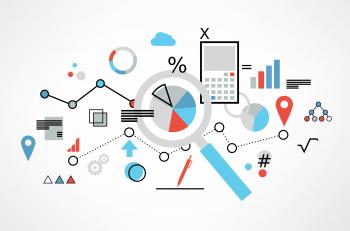
Data Analytics and Research - Illustration
General Statistics and Mathematical Analysis - Concept
Money with financial graph - Money and markets concept
Simple Connected Cloud
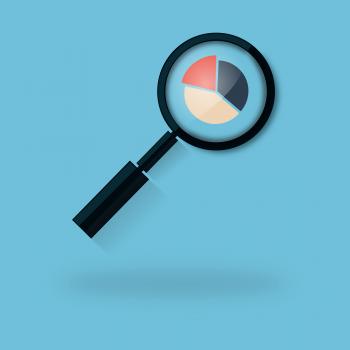
Analyzing a Pie Chart
Pie Chart Indicates Stat Graphics And Infochart
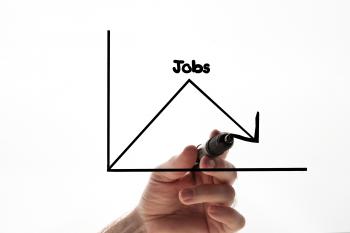
Job trend
Pie Chart And 3d Characters Represents Statistics Report
Online content marketing and web analytics concept
Concept of Search Engine Optimization with SEO icons
Businessman With Pen Over Financial Data
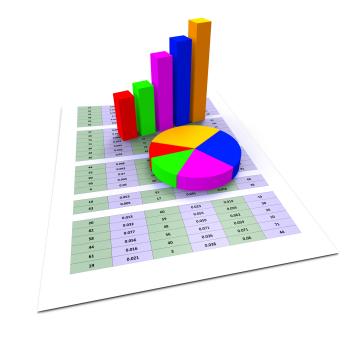
Graph Report Shows Infograph Finance And Graphic
ata Analytics Concept
Prices Increase Represents Financial Report And Diagram
Business man drawing social network or b
Data Analytics and Statistics
Web Stats Indicates Business Graph And Analysing
Success Graph Means Winner Resolution And Winning
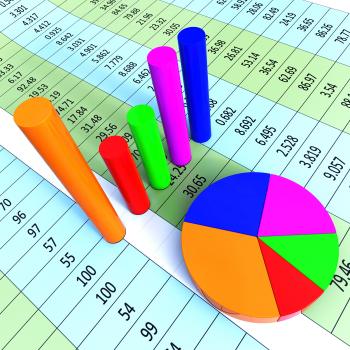
Pie Chart Report Represents Business Graph And Diagram
Online Report Represents World Wide Web And Computing
Calculate Statistics Shows Calculated Data And Statistical
Graph Report Represents Trade Corporate And Finance
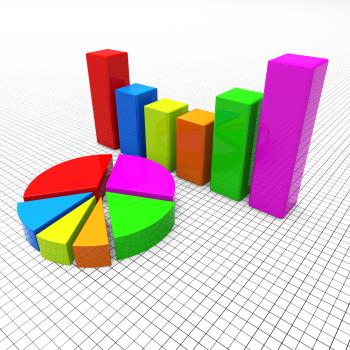
Pie Chart Shows Business Graph And Charting
Money and Financial Data
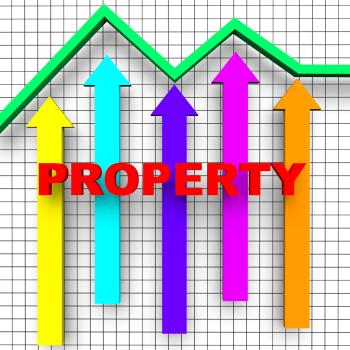
Property Report Indicates Business Graph And House
Search Icon On Mesh Network
People at a Public Place - Social Beings - Colorized Faded Looks
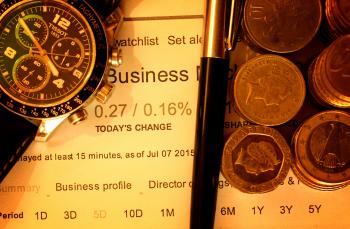
Money with pen and watch
Concept
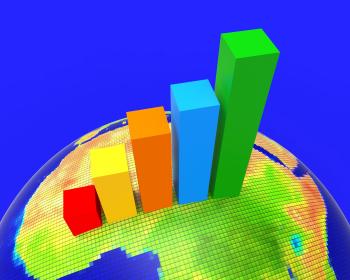
Africa Graph Indicates Financial Report And Analysis
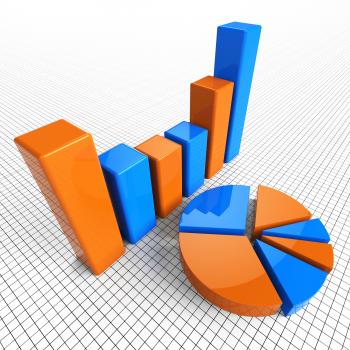
Graph Report Indicates Business Statistic And Diagram
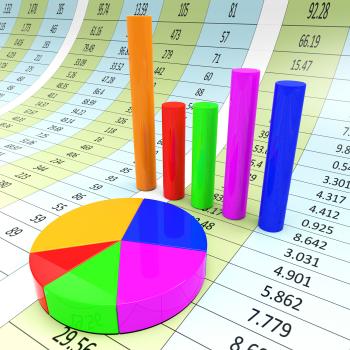
Graph Report Indicates Diagram Charts And Analysis
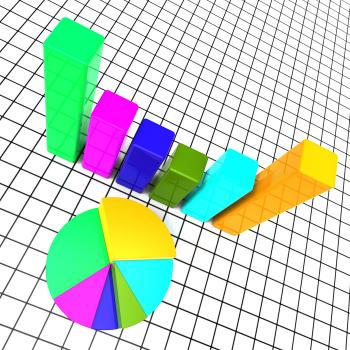
Pie Chart Report Means Data Reports And Graph
Business Graph Means Infochart Diagram And Statistic
Concept of Search Engine Optimization
Taxes Graph Means Duty Statistical And Infograph
Statistics Data Indicates Stats Bytes And Reports
Reports Charts Shows Business Graph And Data
Analytics Tools Represents Business Graph And App
Arrow Pointing Up On Screen Shows Successful Sales
Pie Chart Online Represents Financial Report And Web
Revenues Charts Represents Business Graph And Salary
Profits Graph Shows Earn Investment And Diagram
Graph Audit Indicates Auditing Infograph And Scrutiny
Increase Graph Represents Text Space And Copy
Progress Arrows Represents Business Graph And Advance
Big Discount Indicates Cut Rate And Data
Digital Cloud Concept with Lightning
Cash Flow Graph Represents Investment Earn And Wage
Risk Graph Shows Infochart Beware And Risky
Investment Charts Shows Business Graph And Forecast
Savings Increasing Indicates Financial Report And Advance
Graph Report Shows Graphs Charts And Infochart
Online Stats Means Web Site And Analysing
Graph Earn Represents Graphics Salaries And Income
Cancer Graph Indicates Cancerous Growth And Diagram
Budget Graph Means Costing Expenditure And Statistic
Data Charts Indicates Business Graph And Bytes
Pie Chart Indicates Financial Report And Charts
Investment Guide Indicates Business Graph And Advise
Online Reports Means Tablet Pc And Charting
Business Graph Indicates Diagram Infochart And Profit
Arrow Pointing Up On Smartphone Showing Progression Report
Arrow Pointing Up On Screen Showing Positive Results
Investment Rates Represents Invested Percent And Percentage
Data Graphs Means Statistical Diagram And Bytes
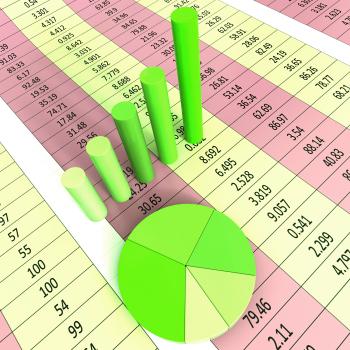
Report Graph Represents Infograph Diagram And Financial
Growing Chart Showing Economy Reports
Arrow Rising On Smartphone Shows Progress Chart
Pie Chart Report Indicates Business Graph And Document
Stats Puzzle Shows Statistics Reports Or Analysis
Arrow Going Up On Screen Shows Sudden Growth