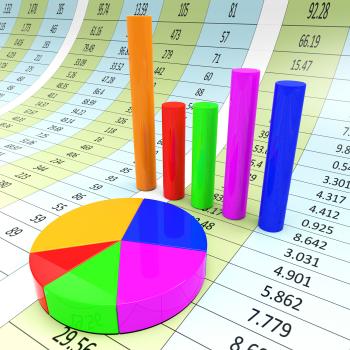
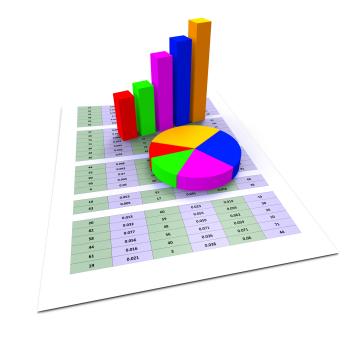
Graph Report Indicates Diagram Charts And Analysis
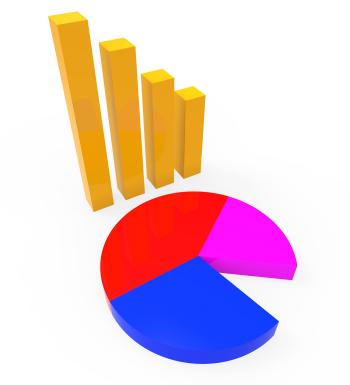
Pie Chart Report Means Data Reports And Graph
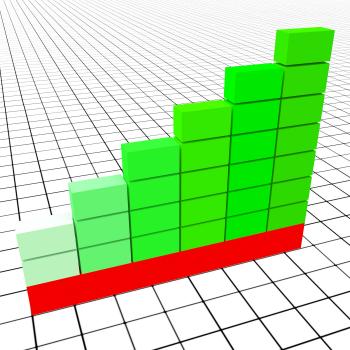
Business Graph Means Infochart Diagram And Statistic
Concept of Search Engine Optimization
Taxes Graph Means Duty Statistical And Infograph
Statistics Data Indicates Stats Bytes And Reports
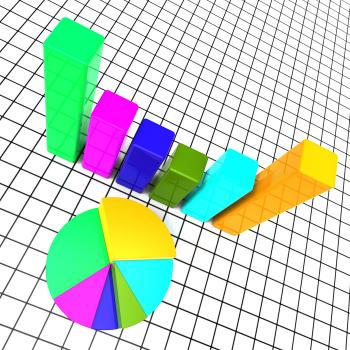
Reports Charts Shows Business Graph And Data
Analytics Tools Represents Business Graph And App
Arrow Pointing Up On Screen Shows Successful Sales
Pie Chart Online Represents Financial Report And Web
Revenues Charts Represents Business Graph And Salary
Profits Graph Shows Earn Investment And Diagram
Pie Chart Shows Business Graph And Charting
Graph Audit Indicates Auditing Infograph And Scrutiny
Increase Graph Represents Text Space And Copy
Progress Arrows Represents Business Graph And Advance
Big Discount Indicates Cut Rate And Data
Digital Cloud Concept with Lightning
Cash Flow Graph Represents Investment Earn And Wage
Risk Graph Shows Infochart Beware And Risky
Investment Charts Shows Business Graph And Forecast
Savings Increasing Indicates Financial Report And Advance
Graph Report Shows Graphs Charts And Infochart
Online Stats Means Web Site And Analysing
Graph Earn Represents Graphics Salaries And Income
Cancer Graph Indicates Cancerous Growth And Diagram
Budget Graph Means Costing Expenditure And Statistic
Data Charts Indicates Business Graph And Bytes
Pie Chart Indicates Financial Report And Charts
Investment Guide Indicates Business Graph And Advise
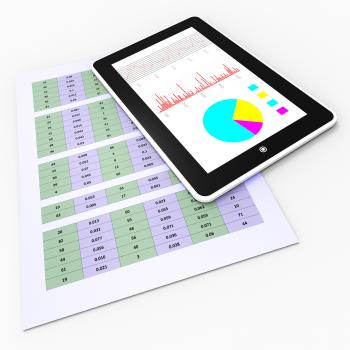
Online Reports Means Tablet Pc And Charting
Business Graph Indicates Diagram Infochart And Profit
Arrow Pointing Up On Smartphone Showing Progression Report
Arrow Pointing Up On Screen Showing Positive Results
Investment Rates Represents Invested Percent And Percentage