Africa Graph Indicates Financial Report And Analysis
Graph Increasing Indicates Growth Statistics And Increase
Decreasing Report Shows Graphic Analysis And Graphs
Graph Report Represents Trade Corporate And Finance
Business Report Shows Financial Infochart And Graphs
Target Report Represents Business Graph And Analysis
Increase Revenue Represents Business Graph And Advancing
Pie Chart Report Means Data Reports And Graph
Cancer Graph Indicates Cancerous Growth And Diagram
Property Report Indicates Business Graph And House
Data Graphs Means Statistical Diagram And Bytes
Graph Report Indicates Diagram Charts And Analysis
Revenues Charts Represents Business Graph And Salary
Graph Report Shows Infograph Finance And Graphic
Big Discount Indicates Cut Rate And Data
Pie Chart Report Represents Business Graph And Diagram
Pie Chart Report Indicates Business Graph And Document
Data Charts Indicates Business Graph And Bytes
Pie Chart Indicates Financial Report And Charts
Graph Report Shows Graphs Charts And Infochart
Pie Chart Indicates Stat Graphics And Infochart
Profits Graph Shows Earn Investment And Diagram
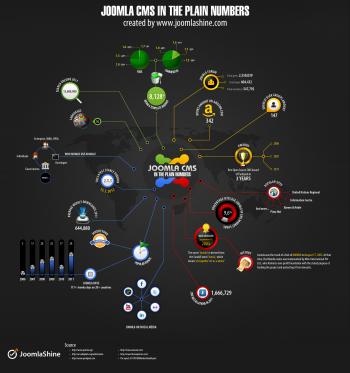
Joomla in the plain numbers
Investment Charts Shows Business Graph And Forecast
Business Graph Indicates Diagram Infochart And Profit
Risk Graph Shows Infochart Beware And Risky
Graph Increasing Shows Financial Report And Advance
Budget Graph Means Costing Expenditure And Statistic
Graph Earn Represents Graphics Salaries And Income
Cash Flow Graph Represents Investment Earn And Wage
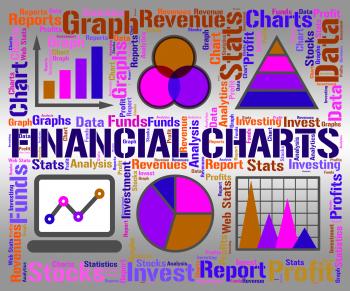
Financial Charts Shows Business Graph And Banking
Data Charts Represents Web Site And Facts
Investment Rates Represents Invested Percent And Percentage
Business Graph Means Infochart Diagram And Statistic
Success Graph Means Winner Resolution And Winning
Pie Chart Shows Business Graph And Charting