3D Chart
Increase Revenue Represents Business Graph And Advancing
Target Report Represents Business Graph And Analysis
Graph Increasing Means Statistics Infochart And Investment
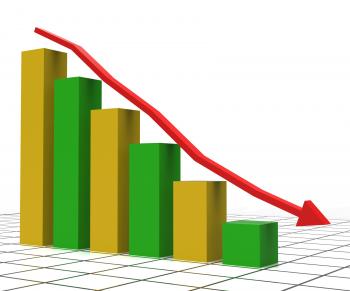
Decreasing Report Represents Business Graph And Decrease
Decreasing Report Shows Graphic Analysis And Graphs
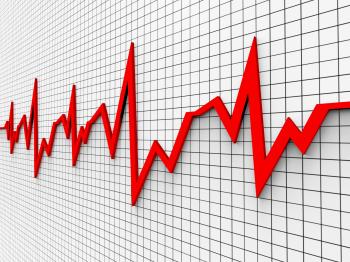
Heartbeat Chart Shows Flat Screen And Cardiograph
Laptop at meeting
Finance Professional - Broker - Financial Advisor - Analyst
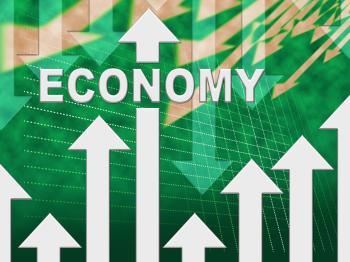
Economy Graph Indicates Micro Economics And Charts
Silver Laptop Computer Showing Pie Graph
Graph Increasing Shows Financial Report And Advance
Growth File Represents Business Graph And Binder 3d Rendering
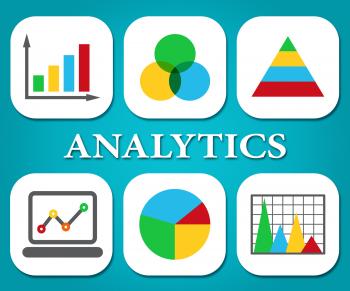
Analytics Charts Represents Business Graph And Statistics
Finance Professional - Broker - Financial Advisor
Exports Increasing Shows International Selling And Exportation
Accounting Graph Shows Paying Taxes And Accounts
Financial Charts Shows Business Graph And Banking
Pie Chart Indicates Stat Graphics And Infochart
Profits Businessman Means Winner Victory And Earning 3d Rendering
Businessman Increase Shows Success Successful And Progress 3d Renderin
Businessman With Pen Over Financial Data
Graph Report Shows Infograph Finance And Graphic
Prices Increase Represents Financial Report And Diagram
ata Analytics Concept
Person Holding Black and Grey Pen
Web Stats Indicates Business Graph And Analysing
Revenue File Indicates Business Graph And Chart 3d Rendering
Success Graph Means Winner Resolution And Winning
Online Report Represents World Wide Web And Computing
Pie Chart Report Represents Business Graph And Diagram
Closeup of tax graph and pen
Paper Beside Macbook
Graph Report Represents Trade Corporate And Finance
Pie Chart Shows Business Graph And Charting
Property Report Indicates Business Graph And House
Africa Graph Indicates Financial Report And Analysis
Graph Report Indicates Business Statistic And Diagram
Business Report Shows Financial Infochart And Graphs
Graph Report Indicates Diagram Charts And Analysis
Blue Arrows Background Means Graph Upwards And Growth
Pie Chart Report Means Data Reports And Graph
Business Graph Means Infochart Diagram And Statistic
Taxes Graph Means Duty Statistical And Infograph
Reports Charts Shows Business Graph And Data
Reports Sphere Definition Means Statistical Diagram Or Company Financi