Broken glass
sky and clouds
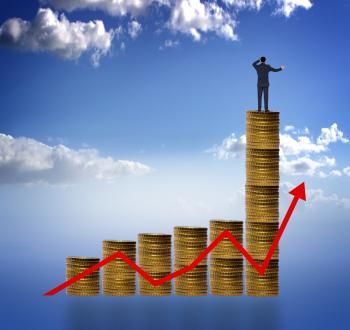
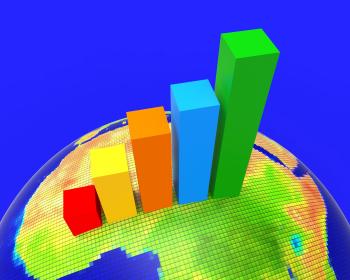
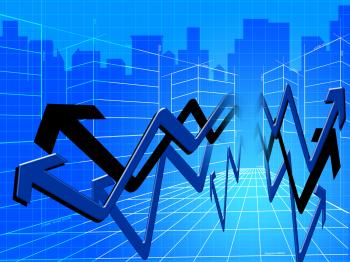
Increase Revenue Represents Business Graph And Advancing
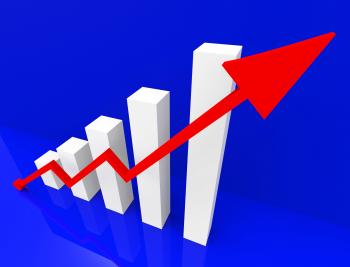
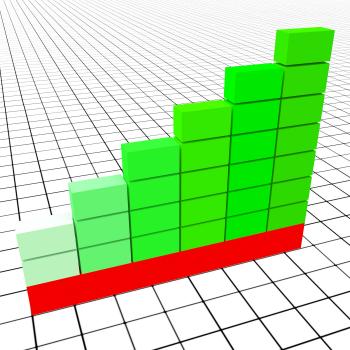
Improve Graph Indicates Improvement Plan And Data
Big Data Analytics
Target Report Represents Business Graph And Analysis
Clouds
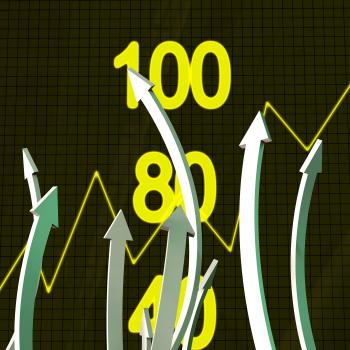
Graph Increasing Means Statistics Infochart And Investment
Man in a Bear Market - Losing Money in the Markets
The Stock Market Game - Bulls and Bears
Decreasing Report Shows Graphic Analysis And Graphs
Businessman holding plant sprouting from a handful of golden coins
Heartbeat Chart Shows Flat Screen And Cardiograph
Businessman drawing an arrow over stack of coins
Money and financial assets growth concept
Economy Graph Indicates Micro Economics And Charts
Businessman looking for financial success
The Way Forward - Abstract Background with Arrows
Markets Graph Negative Indicates Investments Down 3d Rendering
Graph Increasing Shows Financial Report And Advance
Web analytics concept with data icons
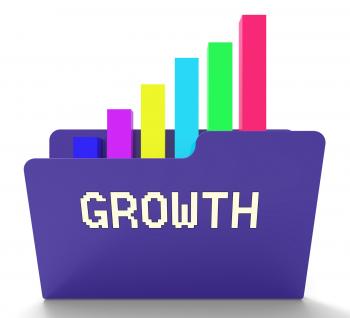
Growth File Represents Business Graph And Binder 3d Rendering
Web analytics concept - Multicolor version
Hand placing coins on a coin stack with upward arrow
Cloud-based apps illustration
Analytics Charts Represents Business Graph And Statistics
Exports Increasing Shows International Selling And Exportation
Environmental Inputs to the Brain - Perception Concept
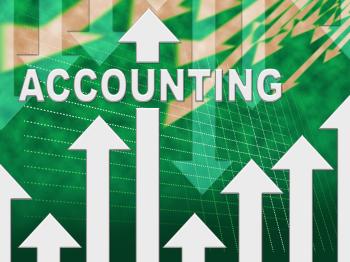
Accounting Graph Shows Paying Taxes And Accounts
Financial Charts Shows Business Graph And Banking
Budget Graph Negative Shows Budgeting Decline 3d Rendering
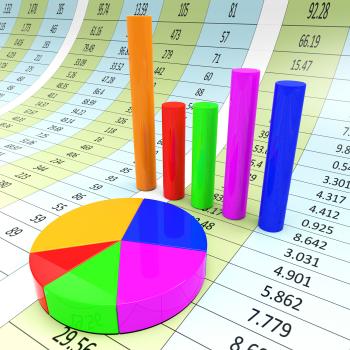
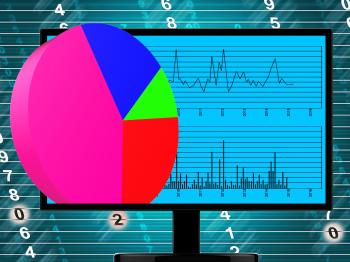
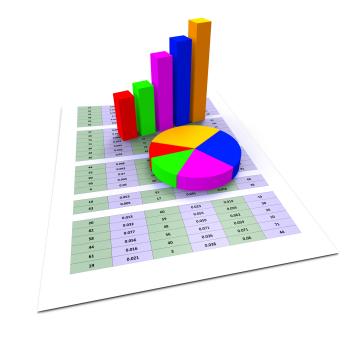
Pie Chart Indicates Stat Graphics And Infochart
Statistics and Figures - Data Analytics Concept
Blue Percentage Symbol Shows Reduced Price
Online content marketing and web analytics concept
Businessman With Pen Over Financial Data
ata Analytics Concept
Graph Report Shows Infograph Finance And Graphic
Prices Increase Represents Financial Report And Diagram
Web Stats Indicates Business Graph And Analysing
Daily Thoughts - A Man Thinking - Concept
Revenue File Indicates Business Graph And Chart 3d Rendering
Twenty Eighteen Blocks Represents Happy New Year And Kids
Success Graph Means Winner Resolution And Winning
Thought and Execution - Business and Cognitive Concept with Arrows and
Online Report Represents World Wide Web And Computing
Sun Rain Laptops Shows Weather Forecast Sunny or Raining
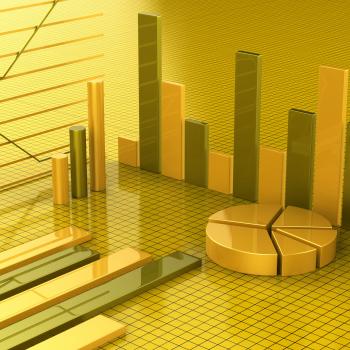
Pie Chart Report Represents Business Graph And Diagram
Safe Digital Cloud Concept
Mobile Phone Shows Cloudy Weather Forecast
Graph Report Represents Trade Corporate And Finance
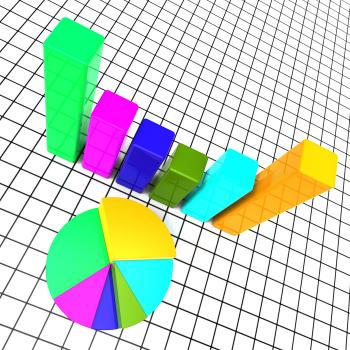
Pie Chart Shows Business Graph And Charting
Vision On Screen Showing Predictions
Credit Graph Indicates Finance And Loan Diagram
Money and Financial Data
Australia Weather Indicates Meteorological Conditions And Forecast
Property Report Indicates Business Graph And House
Profit Graph Phone Shows Sales Revenue And Return
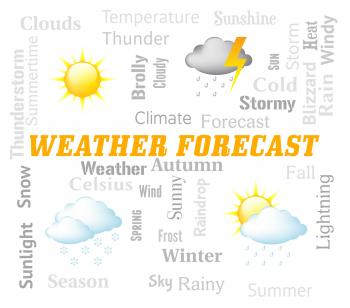
Weather Forecast Indicates Meteorological Conditions And Forecasting
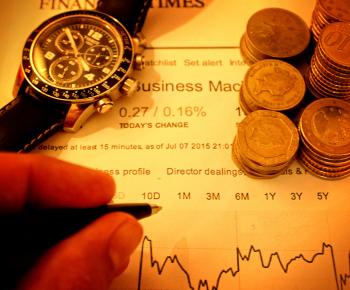
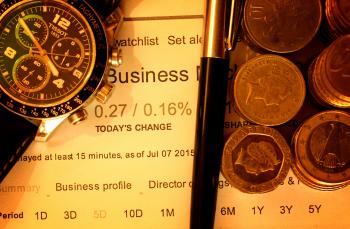
Money with pen and watch
Cloud upload concept
Africa Graph Indicates Financial Report And Analysis
Business Report Shows Financial Infochart And Graphs
Graph Report Indicates Diagram Charts And Analysis
Look Ahead Sign Indicates Future Plans And Message
Pie Chart Report Means Data Reports And Graph
Shares Graph Negative Represents Exchange Funds 3d Rendering
Business Graph Means Infochart Diagram And Statistic
Past Present And Future Keys Show Evolution Or Aging
Weather Forecast Indicates Meteorological Conditions And Forecaster
Twenty Nineteen Represents 2019 New Year 3d Illustration
Sun Rain Keys Mean Weather And Seasons
Hands showing euro coins
Taxes Graph Means Duty Statistical And Infograph
Reports Charts Shows Business Graph And Data
Commerce Graph Represents Ecommerce Trade And Forecast
Analytics Tools Represents Business Graph And App
Your Future Shows Pointing Advertisement And Forecasting
Bad Weather Ahead Signpost Shows Dangerous Prediction
Red Left Arrow Ahead Shows Growth
Pie Chart Online Represents Financial Report And Web
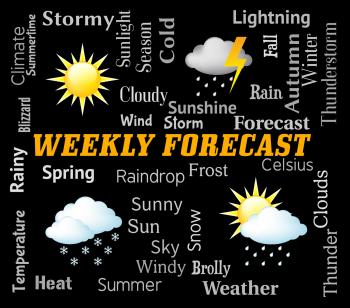
Weekly Forecast Represents Bad Weather And Forecasts
Revenues Charts Represents Business Graph And Salary
New Year Represents Two Thousand Eighteen And Celebrating
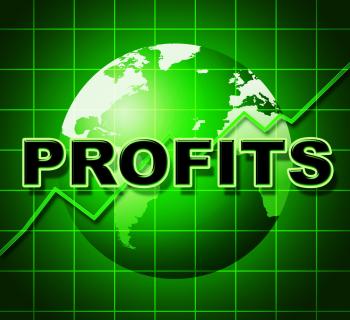
Profits Graph Shows Earn Investment And Diagram
Snow Forecast Online Means Bad Weather And Internet
2015 Accurate Dart Target Shows Successful Future
Weather Station
Target Smartphone Displays Goals Aims And Objectives
Increase Graph Represents Text Space And Copy
2015 Calendar Shows Future Target Plan
Red Right Arrow Ahead Shows Growth
Graph Audit Indicates Auditing Infograph And Scrutiny
Progress Arrows Represents Business Graph And Advance
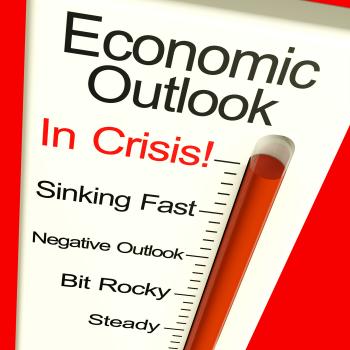
Economic Outlook In Crisis Monitor Showing Bankruptcy And Depression
Big Discount Indicates Cut Rate And Data
Cash Flow Graph Represents Investment Earn And Wage
Investment Charts Shows Business Graph And Forecast
Risk Graph Shows Infochart Beware And Risky
Destiny Sign Represents Pointing Progress And Future
Sales Key Shows Web Selling And Financial Forecast
Downturn Graph Represents Market Chart And Loss 3d Rendering
Bad Weather Ahead Sign Shows Dangerous Prediction
Mobile Phone Shows Cloudy Sun Weather Forecast
Savings Increasing Indicates Financial Report And Advance
Graph Report Shows Graphs Charts And Infochart
Time Line Represents Timeline Chart And Done
Goals Targets Indicates Aspirations Objectives And Forecast
Graph On Screen Shows Increase Sales Achievement
Budget Graph Means Costing Expenditure And Statistic
Graph Earn Represents Graphics Salaries And Income
Future Word On Abstract Map Showing Forecasting And Prediction
Cancer Graph Indicates Cancerous Growth And Diagram
Data Charts Indicates Business Graph And Bytes
Sun Rain Signpost Displays Weather Forecast Sunny or Raining
Pie Chart Indicates Financial Report And Charts
Local Weather Means City Or Town Forecast
Investment Guide Indicates Business Graph And Advise
2016 Accurate Dart Target Shows Successful Future
New Year Represents Two Thousand Nineteen And Annual
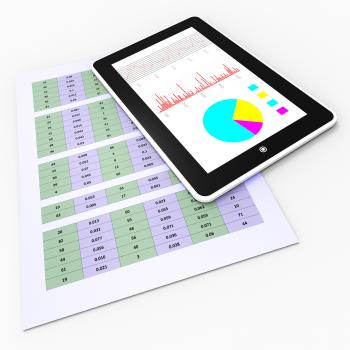
Online Reports Means Tablet Pc And Charting
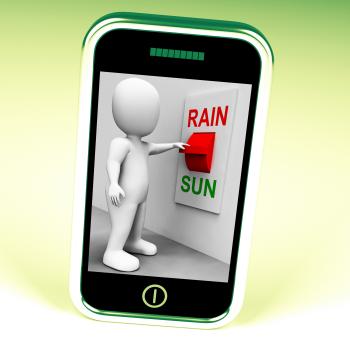
Sun Rain Switch Shows Weather Forecast Sunny or Raining
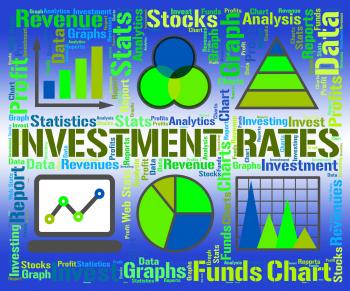
Investment Rates Represents Invested Percent And Percentage
Two Thosand Twenty Represents New Year And Children
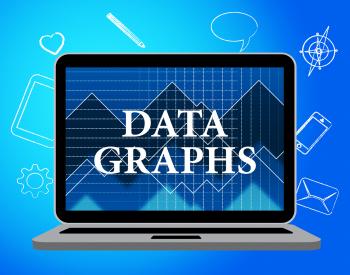
Data Graphs Means Statistical Diagram And Bytes
Profit Graph Shows Sales Revenue And Return
Profit Piggy Bank Means Revenue Return And Surplus
Now Time Shows At The Moment And Earlier
Report Graph Represents Infograph Diagram And Financial
Targets Words Represents Projection Business And Aiming
Gbp Graph Negative Shows British Pound 3d Rendering
Pie Chart Report Indicates Business Graph And Document
Sun Rain Computer Mean Weather And Seasons
Mobile Smartphone Shows Rain Weather Forecast
Past, Present, Future Dice Showing Forecasts
Earnings Graph Negative Indicates Wage Crisis 3d Rendering
New Year Shows Two Thousand Eighteen And Celebrate
New Year Shows Two Thousand Eighteen And Annual