Pie Chart Indicates Stat Graphics And Infochart
Statistics and Figures - Data Analytics Concept
Blue Percentage Symbol Shows Reduced Price
Online content marketing and web analytics concept
Businessman With Pen Over Financial Data
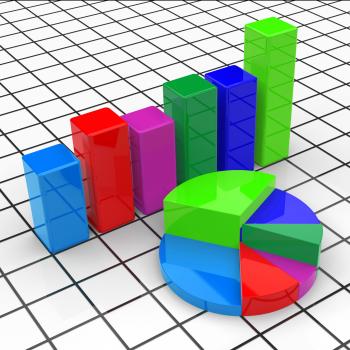
Graph Report Shows Infograph Finance And Graphic
ata Analytics Concept
Prices Increase Represents Financial Report And Diagram
Web Stats Indicates Business Graph And Analysing
Daily Thoughts - A Man Thinking - Concept
Revenue File Indicates Business Graph And Chart 3d Rendering
Twenty Eighteen Blocks Represents Happy New Year And Kids
Thought and Execution - Business and Cognitive Concept with Arrows and
Success Graph Means Winner Resolution And Winning
Online Report Represents World Wide Web And Computing
Sun Rain Laptops Shows Weather Forecast Sunny or Raining
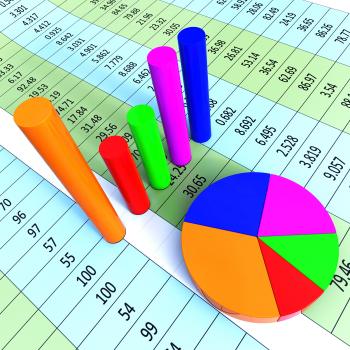
Pie Chart Report Represents Business Graph And Diagram
Safe Digital Cloud Concept
Mobile Phone Shows Cloudy Weather Forecast
Graph Report Represents Trade Corporate And Finance
Vision On Screen Showing Predictions
Pie Chart Shows Business Graph And Charting
Credit Graph Indicates Finance And Loan Diagram
Money and Financial Data
Australia Weather Indicates Meteorological Conditions And Forecast
Profit Graph Phone Shows Sales Revenue And Return
Property Report Indicates Business Graph And House
Weather Forecast Indicates Meteorological Conditions And Forecasting
Africa Graph Indicates Financial Report And Analysis
Money with pen and watch
Cloud upload concept
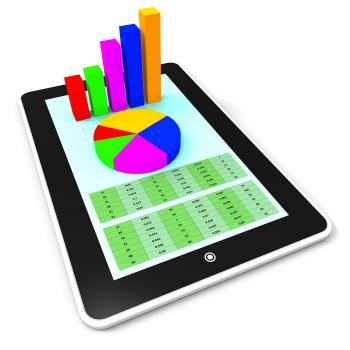
Business Report Shows Financial Infochart And Graphs
Graph Report Indicates Diagram Charts And Analysis
Look Ahead Sign Indicates Future Plans And Message