Debt Businessman Shows Lack Of Success And Accounting 3d Rendering
Flow Diagram Represents Charting Organizations And Graph
Budget Graph Means Costing Expenditure And Statistic
Graph Earn Represents Graphics Salaries And Income
Cancer Graph Indicates Cancerous Growth And Diagram
Graph On Screen Shows Increase Sales Achievement
Bonus Chart Graph Displays Increase Reward Or Perk
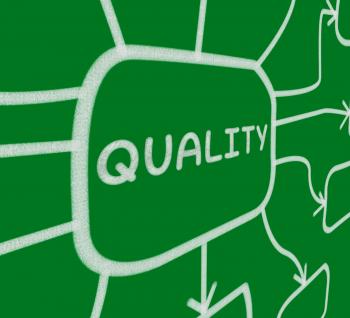
Quality Diagram Displays Grade State Or Condition
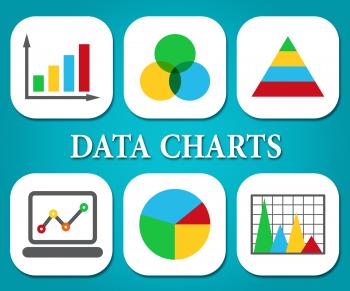
Data Charts Indicates Business Graph And Bytes
Business Diagram Means Company Venture Or Commerce
Turned on Iphone 5 on Prospekt Newsletter 2016
File Designs Indicates Paperwork Plan And Organized
Female hand writing on a paper
Tactics Sphere Definition Displays Management Plan Or Strategy
Pie Chart Indicates Financial Report And Charts
Decisions Diagram Means Reports And Deciding On Products
Supply Sphere Definition Shows Goods Provision Or Product Demand
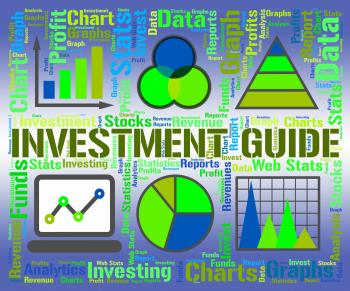
Investment Guide Indicates Business Graph And Advise
Commerce Diagram Displays Marketing Sales And Profit
Quality Diagram Means Grade State Or Condition
Business Graph Indicates Diagram Infochart And Profit
Colorful Diagram With Four Arrows Showing Process Or Illustration
Training Diagram Displays Mentorship Education And Job Preparation
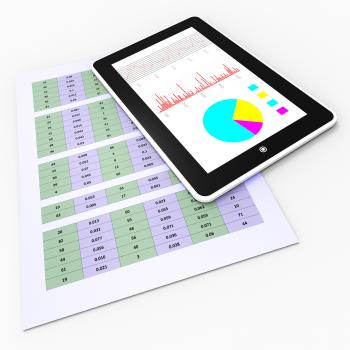
Online Reports Means Tablet Pc And Charting
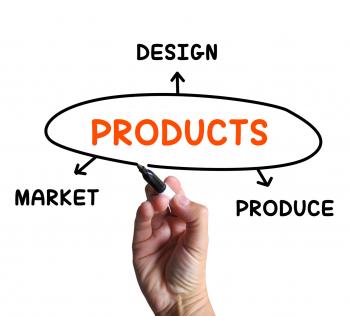
Products Diagram Shows Designing And Marketing Goods
Business Strategy Diagram Showing Teamwork And Planning
Internet Laptop Means Searching Social Networks Blogging And Online Co
Spending Chart Graph Shows Increasing Expenditure Purchasing
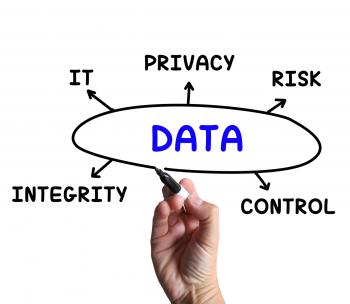
Data Diagram Means IT Control And Risk
Design Dice Mean to Design Create and to Diagram
Management Diagram Displays Authority Directors And Board
Investment Rates Represents Invested Percent And Percentage
Data Graphs Means Statistical Diagram And Bytes
Tactics Magnifier Definition Shows Management Plan Or Strategy
Finance Diagram Shows Credit Equity And Margin
To the Moon and Back Written Paper
Sales Chart Graph Displays Increasing Profits Trade
Site Map Arrows Means Navigating Around Website
Report Graph Represents Infograph Diagram And Financial
Infographic Computer Indicates Infographics Online And Statistics
Credit Graph Chart Displays Buy Increase Grow Debt
Round Gray Steel Ornament
Market Research Diagram Displays Researching Consumer Demand And Prefe
Reports Dice Represent Reported Information or Articles
Software Development Diagram Shows Implement Maintain And Verify
SEO Diagram Displays Optimized For Search Engines
Earn Graph Chart Shows Increase Earnings Growing
Pie Chart Report Indicates Business Graph And Document
Raising Profits Chart Showing Business Success
Raising Profits Chart Shows Balance Progress
Designs Blocks Mean to Design Create and to Diagram
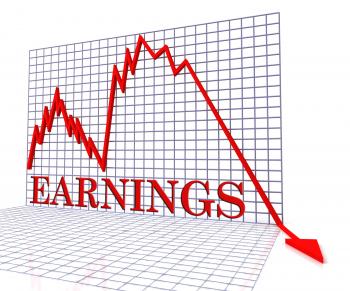
Earnings Graph Negative Indicates Wage Crisis 3d Rendering
Report Dice Represent Reported Information or Articles
Salary Chart Graph Displays Increase Earn Cash Wealth Revenue
Training Diagram Shows Workshops Groundwork And Educating
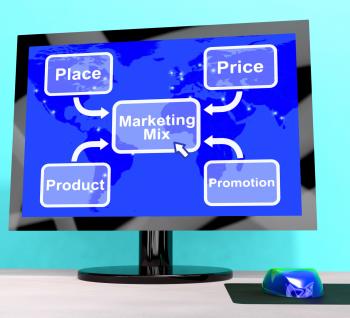
Marketing Mix With Price Product And Promotion
Save Chart Graph Displays Increasing Savings Investment