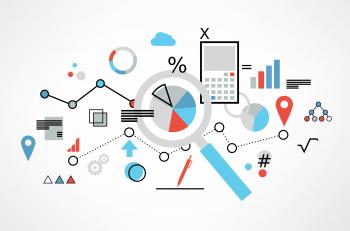
Data Graphs Means Statistical Diagram And Bytes
Concept of Search Engine Optimization
Concept of Search Engine Optimization with SEO icons
Sketch of people in a social network
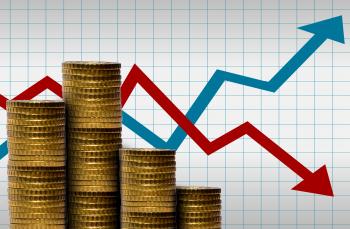
The search for profit when markets are volatile
Online Marketing Diagram Showing Blogs Websites Social Media And Email
Pen on paper with red arrows - Office work concept
Pen on paper with blue arrows - Office work concept
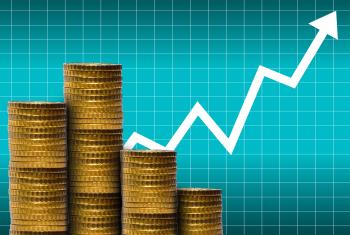
Money with financial graph - Money and markets concept
Money in a pile of coins with financial graph
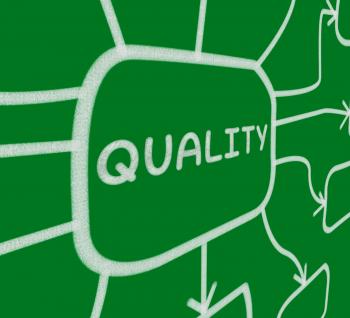
Quality Diagram Means Grade State Or Condition
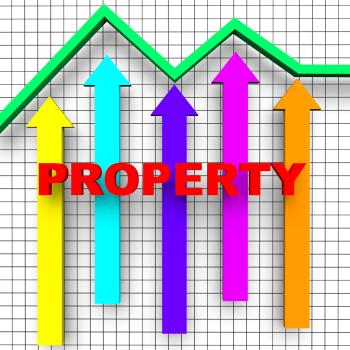
Property Report Indicates Business Graph And House
Cancer Graph Indicates Cancerous Growth And Diagram
Business Diagram Displays Plan Team And Investment
The Stock Market Game - Bulls and Bears
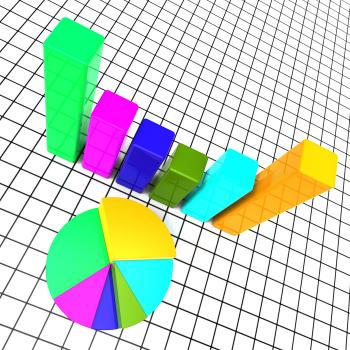
Pie Chart And 3d Characters Represents Statistics Report
Blank Diagram Blackboard Shows Business Plan Arrows Flow Chart
Flow Diagram Represents Charting Organizations And Graph
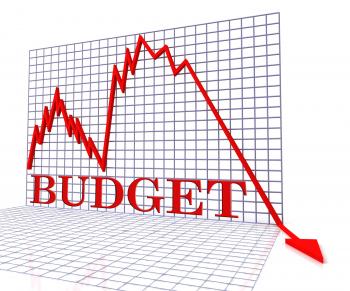
Budget Graph Negative Shows Budgeting Decline 3d Rendering
Plan B Diagram Displays Substitute Or Alternative
Eating well - Healthy italian food ingredients
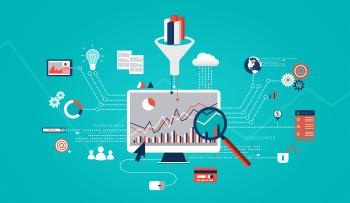
Big Data Analytics
Big Data Analysis and Research - Concept with Mesh
Big Data Analytics and Research - Dark Background
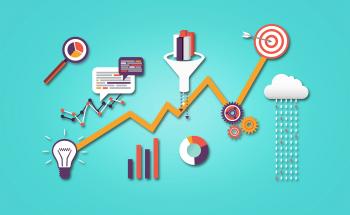
Data Analytics and Research - Illustration
Microchip
Information Technology Concept
SEO - Search Engine Optimization concept
IT - Information Technology network concept
Devices connected by the digital cloud
Web analytics concept - Multicolor version
Web analytics concept with data icons
Online content marketing and web analytics concept
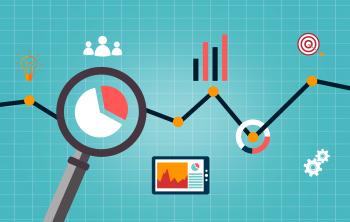
ata Analytics Concept
Interpersonal Communication Idea with Lightbulbs and Devices
Brain Functions as App Icons
Be different and think positive concept
Little girl writing on blackboard
Two little girls writing on a blackboard with science subjects
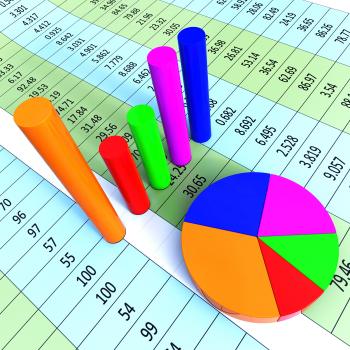
Pie Chart Report Means Data Reports And Graph
Improve Graph Indicates Improvement Plan And Data
Bull versus Bear
Equity markets - Bull versus Bear concept
Bear Market - Markets are Falling
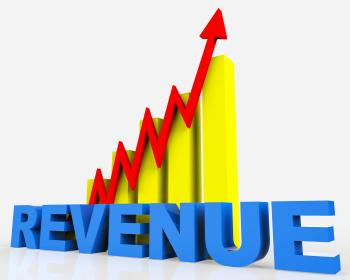
Increase Revenue Represents Business Graph And Advancing
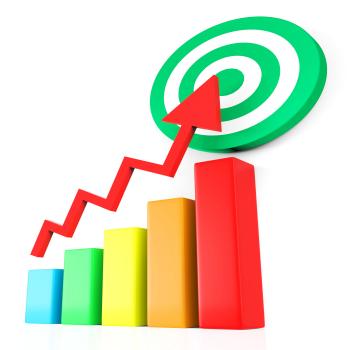
Target Report Represents Business Graph And Analysis
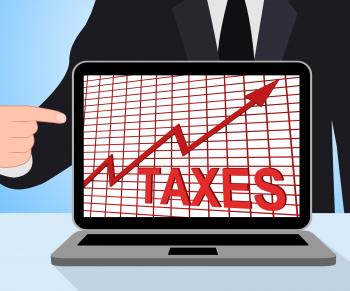
Taxes Chart Graph Displays Increasing Tax Or Taxation
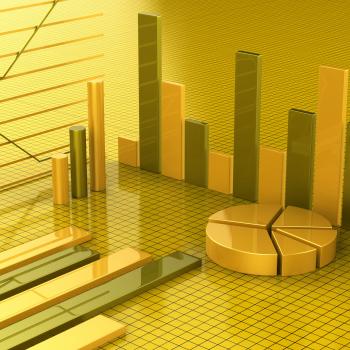
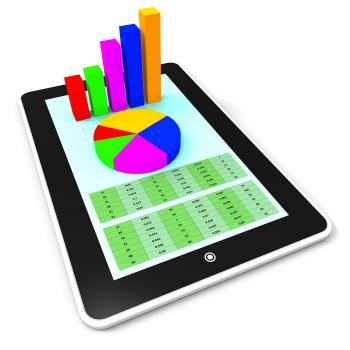
Business Report Shows Financial Infochart And Graphs
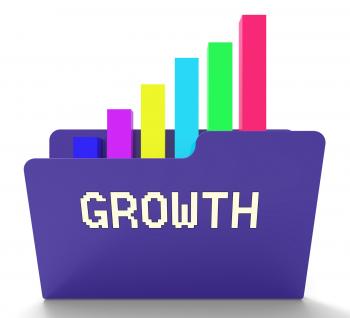
Growth File Represents Business Graph And Binder 3d Rendering
Graph Report Represents Trade Corporate And Finance
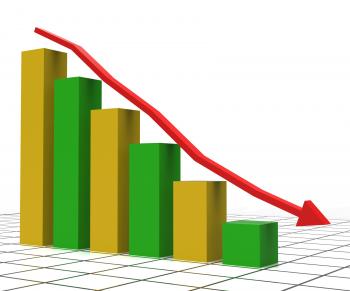
Decreasing Report Shows Graphic Analysis And Graphs
Online Report Represents World Wide Web And Computing
Raising Stocks Chart Shows Monetary Growth
Blue Bar Chart Shows Increased Profit
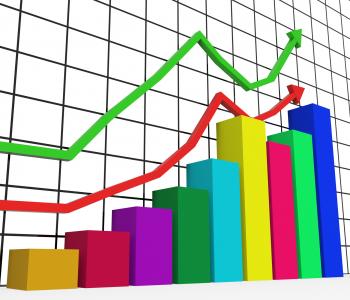
Graph Increasing Indicates Growth Statistics And Increase
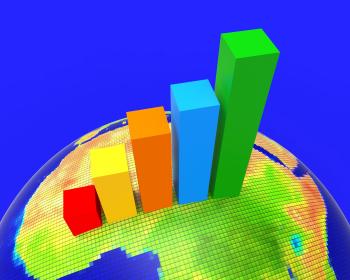
Africa Graph Indicates Financial Report And Analysis