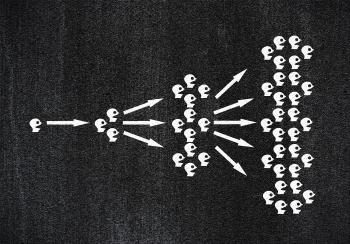
Money in a pile of coins with financial graph
Money with financial graph - Money and markets concept
Online Marketing Diagram Showing Blogs Websites Social Media And Email
The search for profit when markets are volatile
Sketch of people in a social network
Concept of Search Engine Optimization
Data Graphs Means Statistical Diagram And Bytes
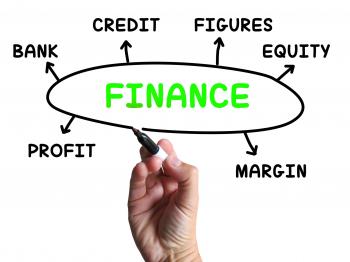
Finance Diagram Shows Credit Equity And Margin
Business Diagram Means Company Venture Or Commerce
Spreading the word - Going viral concept
Darts on target - Search Engine Optimization idea - SEO
Meditation Diagram Means Relaxation Calm And Peace
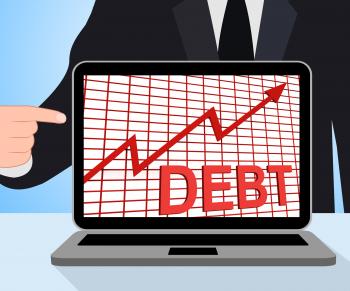
Debt Businessman Shows Lack Of Success And Accounting 3d Rendering
Cloud storage concept
Beating the Street - Or how to make money in stocks
The incredible mighty dollar
The incredible shrinking dollar
Social networks defined by social circles
Quality Diagram Displays Grade State Or Condition
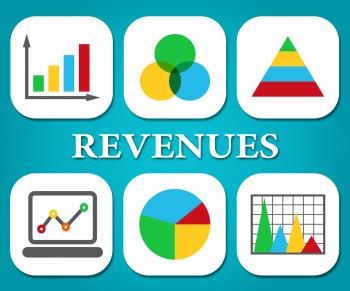
Revenues Charts Represents Business Graph And Salary
Business Diagram Means Plan Team And Investment
Creative brain idea concept
World map with modern triangle pattern
Graph Report Shows Infograph Finance And Graphic
City of London with Financial Graph
The Internet of Things
Detailed world map with modern triangle
Finance graph on Manhattan at night
Finance graph superimposed on Manhattan
Cloud Computing Concept
Debt Graph Chart Displays Increasing Financial Indebted
Education Diagram Displays Aptitude Knowledge And Improving
SEO Chart Graph Shows Increase Search Engine Optimization
Big Discount Indicates Cut Rate And Data
Entrepreneur Diagram Shows Business Person And Start-Up