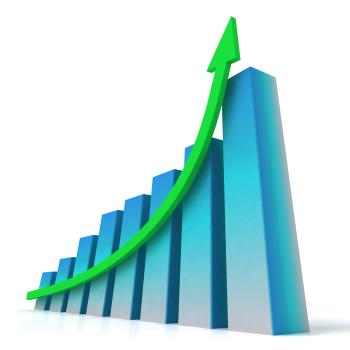
Blue Bar Chart Shows Increased Profit
Raising Stocks Chart Shows Monetary Growth
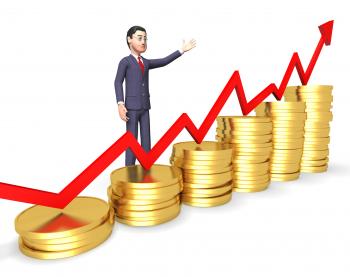
Profits Businessman Means Winner Victory And Earning 3d Rendering
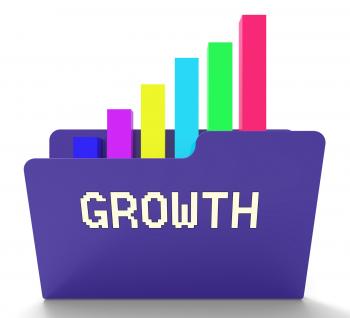
Growth File Represents Business Graph And Binder 3d Rendering
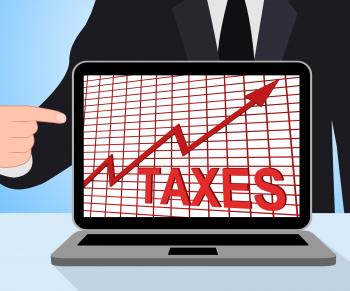
Taxes Chart Graph Displays Increasing Tax Or Taxation
Paint swatches in shop
Paint samples in the shop
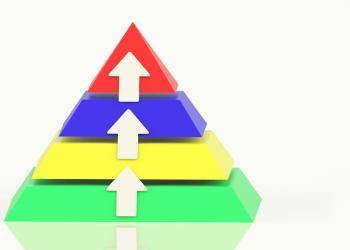
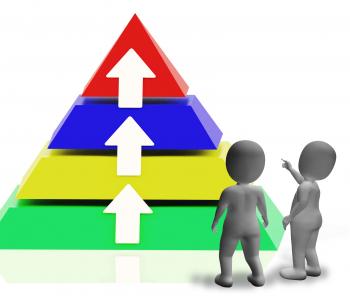
Pyramid With Up Arrows Showing Growth Or Progress
Vinyl records
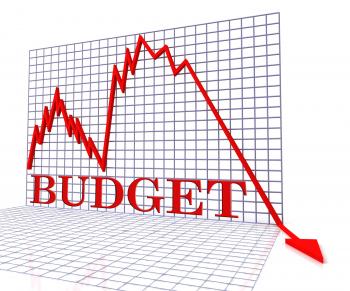
Budget Graph Negative Shows Budgeting Decline 3d Rendering
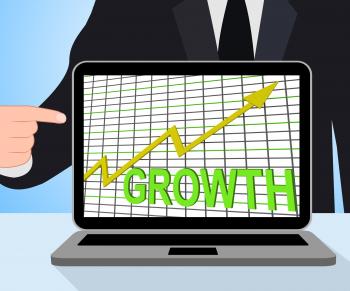
Arrow Pointing Up On Screen Showing Positive Results
Flow Diagram Represents Charting Organizations And Graph
Blank Diagram Blackboard Shows Business Plan Arrows Flow Chart
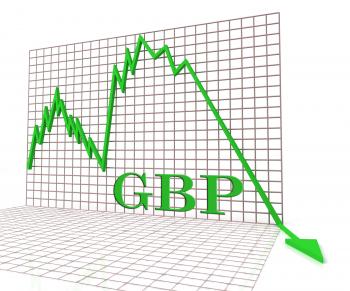
Gbp Graph Negative Shows British Pound 3d Rendering
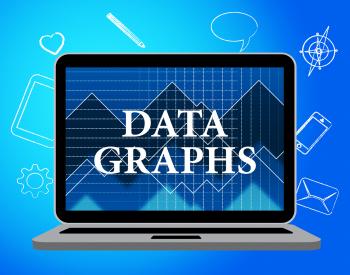
Data Graphs Means Statistical Diagram And Bytes
Debt Businessman Shows Lack Of Success And Accounting 3d Rendering
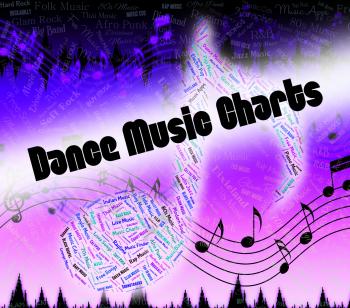
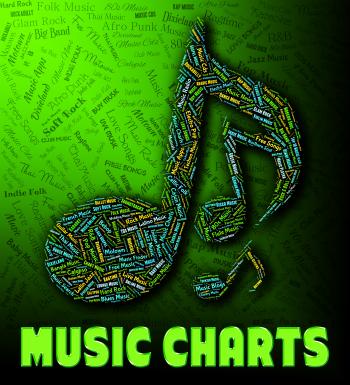
Dance Music Charts Means Sound Tracks And Disco
Revenues Charts Represents Business Graph And Salary
Statistics Data Indicates Stats Bytes And Reports
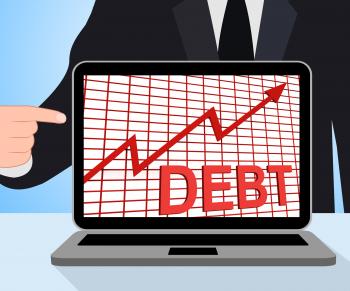
Debt Graph Chart Displays Increasing Financial Indebted
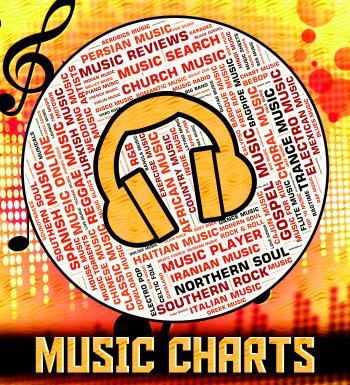
Music Charts Means Best Sellers And Albums
SEO Chart Graph Shows Increase Search Engine Optimization
Flow Diagram Represents Hi Tech And Background
Arrow Pointing Up On Smartphone Showing Progression Report
Blank Output Diagram Shows Schematic Plan Outflow Chart
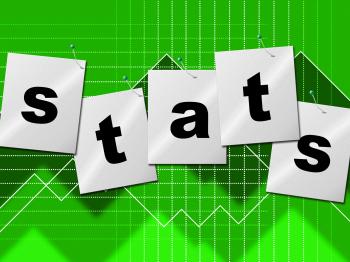
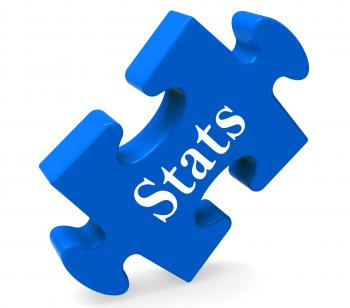
Stats Puzzle Shows Statistics Reports Or Analysis
Graph On Screen Shows Increase Sales Achievement
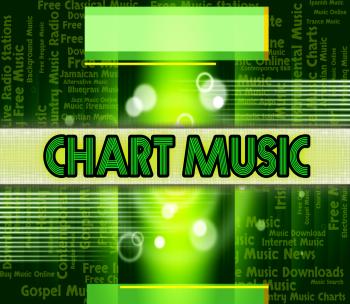
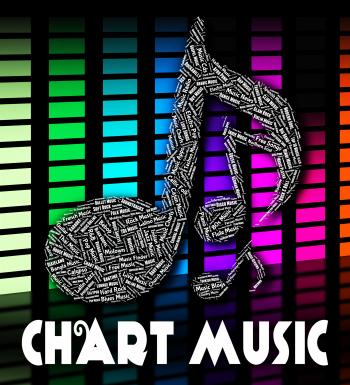
Chart Music Indicates Best Sellers And Albums
Reports Dice Represent Reported Information or Articles
Spending Chart Graph Shows Increasing Expenditure Purchasing
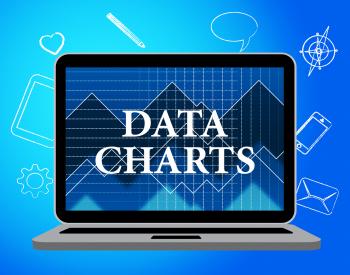
Data Charts Indicates Business Graph And Bytes
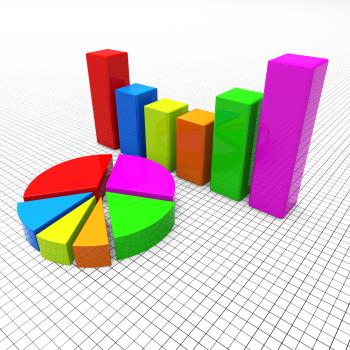
Pie Chart Indicates Financial Report And Charts
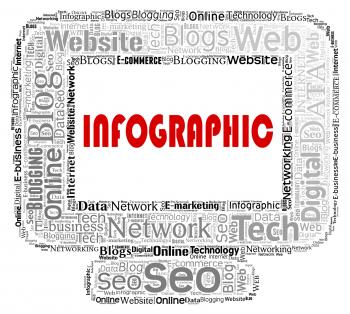
Infographic Computer Indicates Infographics Online And Statistics
Riches Chart Graph Shows Increase Cash Wealth Revenue
Pie Chart Indicates Stat Graphics And Infochart
Pyramid With Up Arrows And Copyspace Showing Growth Or Progress
Earnings Graph Negative Indicates Wage Crisis 3d Rendering
Investment Charts Shows Business Graph And Forecast
Bonus Chart Graph Displays Increase Reward Or Perk
Country Music Charts Shows Best Seller And Audio
Dance Music Charts Means Hit Parade And Disco
Music Charts Shows Sound Tracks And Harmony
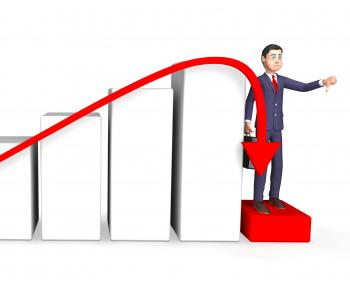
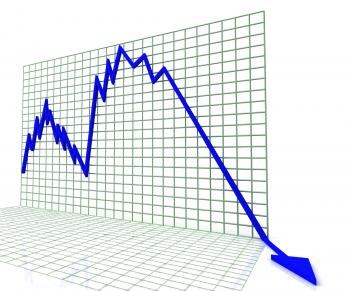
Downturn Graph Represents Market Chart And Loss 3d Rendering
Economy Graph Indicates Micro Economics And Charts
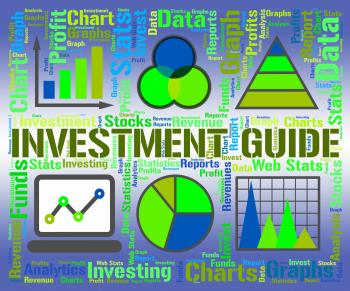
Investment Guide Indicates Business Graph And Advise
Salary Chart Graph Displays Increase Earn Cash Wealth Revenue
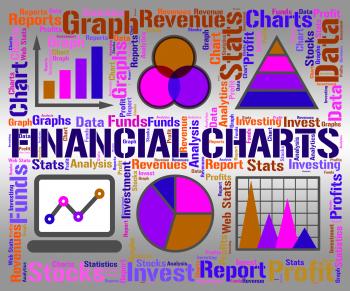
Financial Charts Shows Business Graph And Banking
Forex Graph Means Foreign Currency And Exchange
Hand Touch Touchscreen On World Map Shows Internet Web
Sales Chart Graph Displays Increasing Profits Trade
Music Charts Shows Sound Tracks And Harmonies
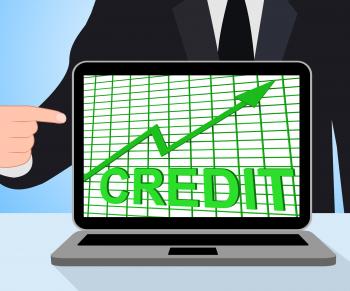
Credit Graph Chart Displays Buy Increase Grow Debt
Data Charts Represents Web Site And Facts
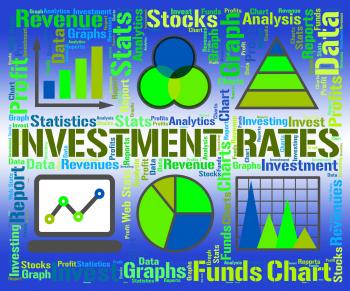
Investment Rates Represents Invested Percent And Percentage
Hand Touch Touchscreen On World Map Shows Internet WWW
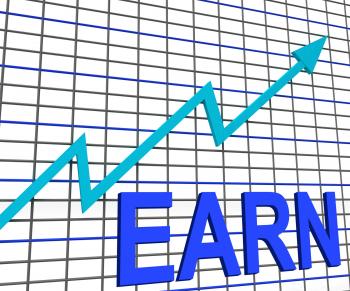
Earn Graph Chart Shows Increase Earnings Growing
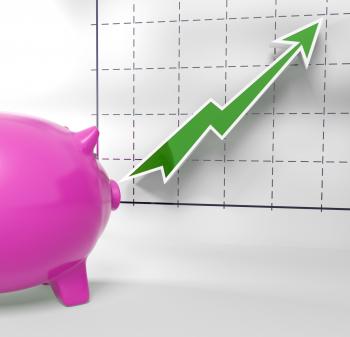
Blue Graph Shows Sales Or Profit
Arrow Pointing Up On Screen Shows Successful Sales
Line Over Bar Chart Shows Profit Follows Budget
Save Chart Graph Displays Increasing Savings Investment
Colorful Diagram With Four Arrows Showing Process Or Illustration
Markets Graph Negative Indicates Investments Down 3d Rendering
Chart Music Represents Sound Track And Charts
Pie Chart Shows Business Graph And Charting
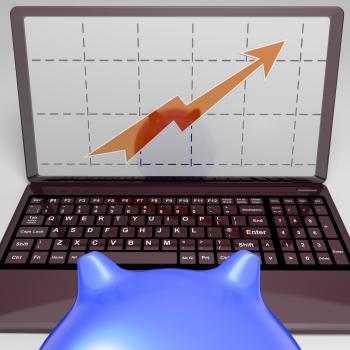
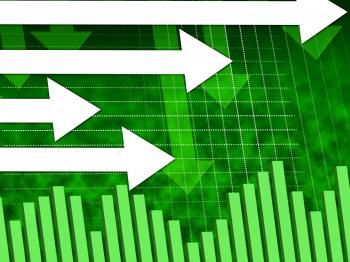
Arrow Going Up On Screen Shows Sudden Growth
Chart Music Represents Top Twenty And Audio
Shares Graph Negative Represents Exchange Funds 3d Rendering
Growing Chart Showing Economy Reports
Arrow Falling On Monitors Showing Bad Statistics
Raising Profits Chart Shows Balance Progress
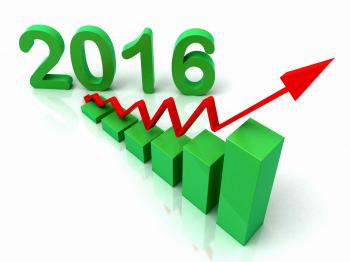
2016 Green Bar Chart Shows Budget
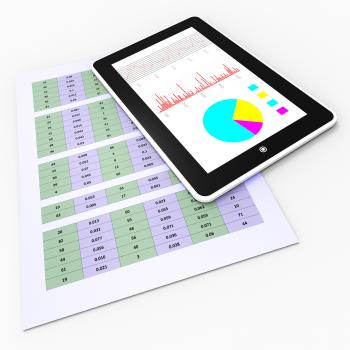
Online Reports Means Tablet Pc And Charting
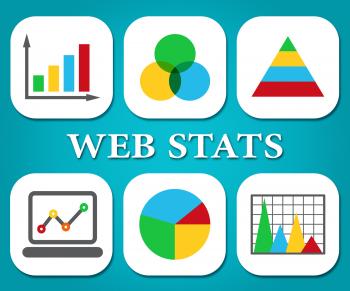
Web Stats Indicates Business Graph And Analysing
Raising Profits Chart Showing Business Success
Growth Graph Chart Displays Increase Sales Profit
Report Dice Represent Reported Information or Articles
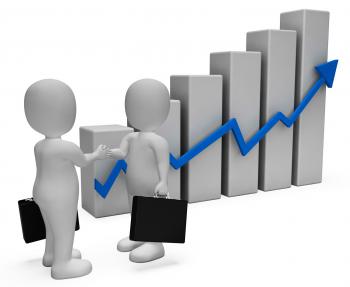
Businessman Increase Shows Success Successful And Progress 3d Renderin
Calculate Statistics Shows Calculated Data And Statistical
Heartbeat Chart Shows Flat Screen And Cardiograph
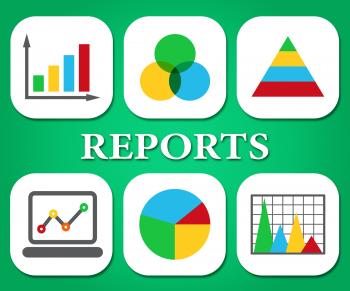
Reports Charts Shows Business Graph And Data
Reports Sphere Definition Means Statistical Diagram Or Company Financi
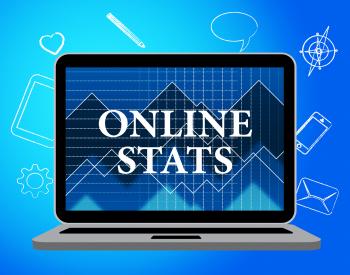
Online Stats Means Web Site And Analysing
Report Blocks Represent Reported Information or Articles
Arrow Rising On Smartphone Shows Progress Chart
Raising Investment Chart Shows Progression
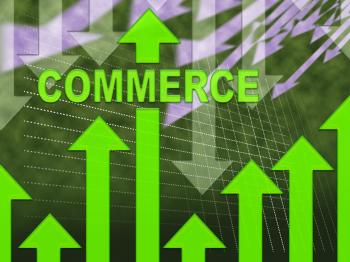
Commerce Graph Represents Ecommerce Trade And Forecast
Analytics Charts Represents Business Graph And Statistics
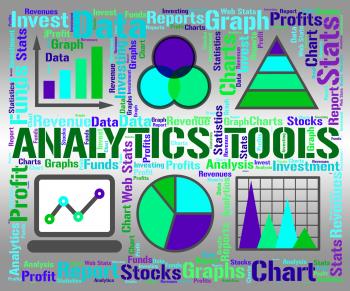
Analytics Tools Represents Business Graph And App
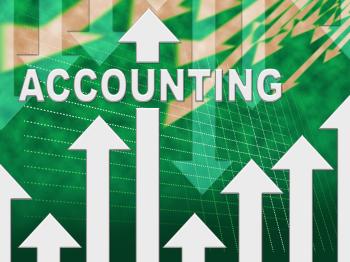
Accounting Graph Shows Paying Taxes And Accounts
Flow Diagram Indicates Flowchart Schematic And Structure
Blue Bar Chart Shows Budget Versus Actual
Revenue File Indicates Business Graph And Chart 3d Rendering
Music Charts Shows Hit Parade And Harmony
Hand
Glasses and chart