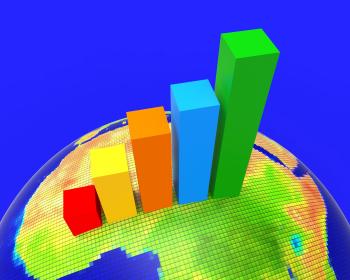
Graph Increasing Indicates Growth Statistics And Increase
Improve Graph Indicates Improvement Plan And Data
Target Report Represents Business Graph And Analysis
Graph Increasing Means Statistics Infochart And Investment
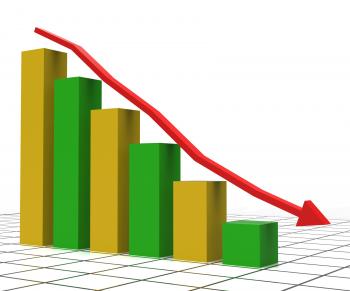
Decreasing Report Represents Business Graph And Decrease
Decreasing Report Shows Graphic Analysis And Graphs
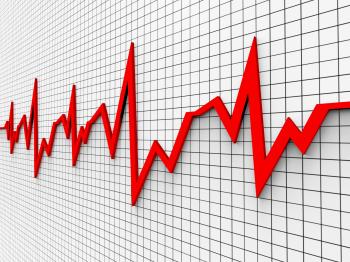
Heartbeat Chart Shows Flat Screen And Cardiograph
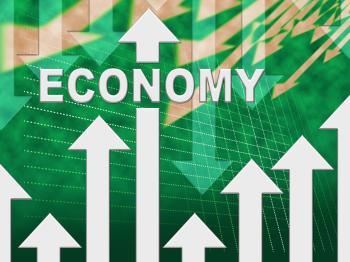
Economy Graph Indicates Micro Economics And Charts
Graph Increasing Shows Financial Report And Advance
Growth File Represents Business Graph And Binder 3d Rendering
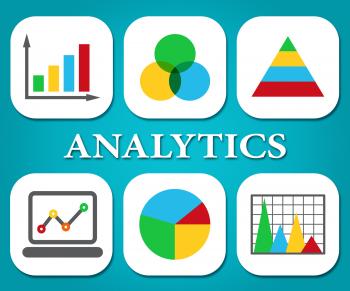
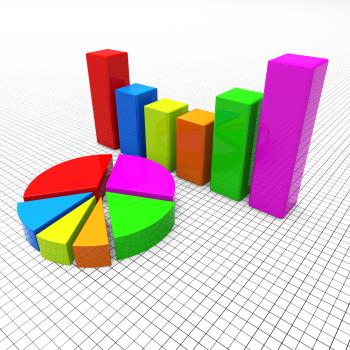
Analytics Charts Represents Business Graph And Statistics
Exports Increasing Shows International Selling And Exportation
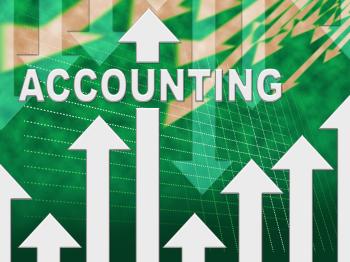
Accounting Graph Shows Paying Taxes And Accounts
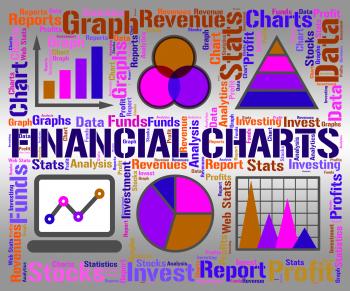
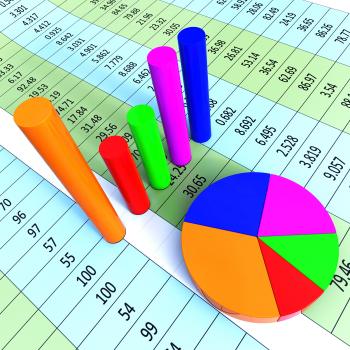
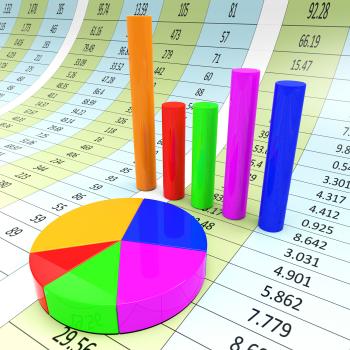
Financial Charts Shows Business Graph And Banking
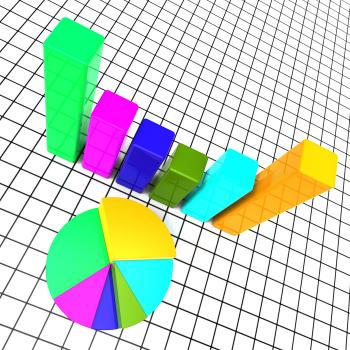
Pie Chart Indicates Stat Graphics And Infochart
Improve Economy Shows Business Graph And Advance
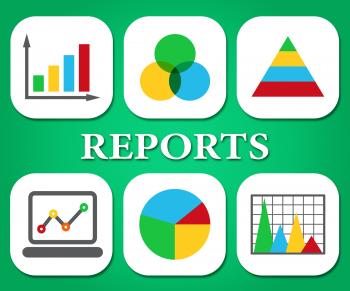
Graph Report Shows Infograph Finance And Graphic
Prices Increase Represents Financial Report And Diagram
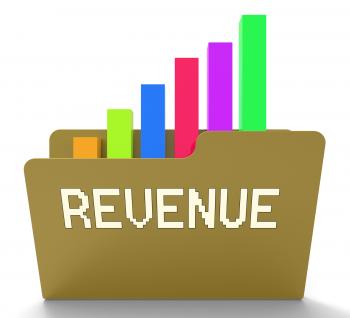
Revenue File Indicates Business Graph And Chart 3d Rendering
Success Graph Means Winner Resolution And Winning
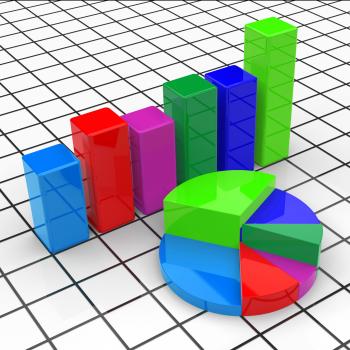
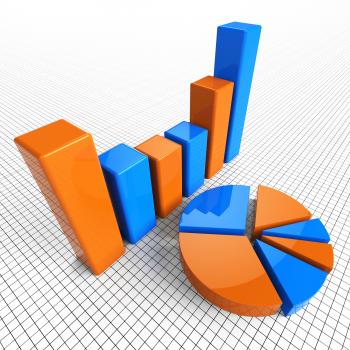
Pie Chart Report Represents Business Graph And Diagram
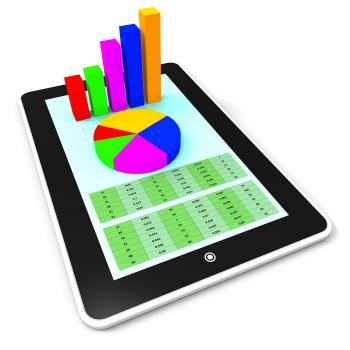
Online Report Represents World Wide Web And Computing
Graph Report Represents Trade Corporate And Finance
Pie Chart Shows Business Graph And Charting
Property Report Indicates Business Graph And House
Africa Graph Indicates Financial Report And Analysis
Graph Report Indicates Business Statistic And Diagram
Graph Report Indicates Diagram Charts And Analysis
Pie Chart Report Means Data Reports And Graph
Business Graph Means Infochart Diagram And Statistic
Taxes Graph Means Duty Statistical And Infograph
Reports Charts Shows Business Graph And Data
Commerce Graph Represents Ecommerce Trade And Forecast
Analytics Tools Represents Business Graph And App
Pie Chart Online Represents Financial Report And Web
Revenues Charts Represents Business Graph And Salary