Report Blocks Represent Reported Information or Articles
Arrow Rising On Smartphone Shows Progress Chart
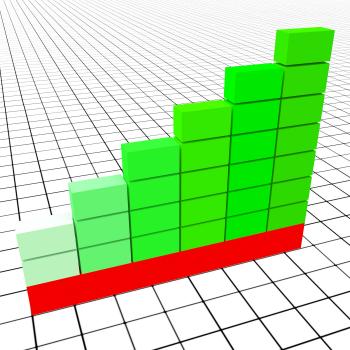
Increase Graph Represents Text Space And Copy
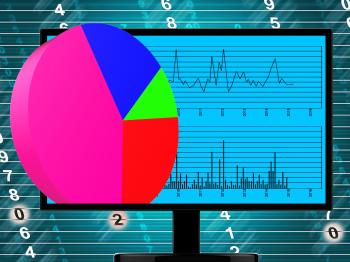
Pie Chart Online Represents Financial Report And Web
Taxes Graph Means Duty Statistical And Infograph
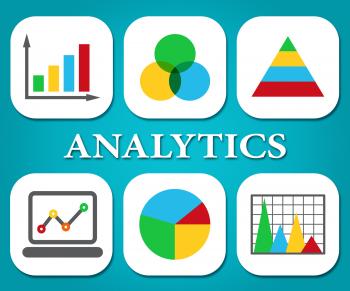
Analytics Charts Represents Business Graph And Statistics
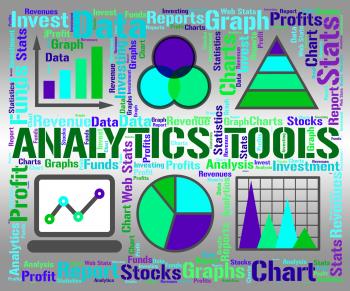
Analytics Tools Represents Business Graph And App
Graph Audit Indicates Auditing Infograph And Scrutiny
Percent Sign With 3d Man Climbing Showing Percentage
Graph Increasing Means Statistics Infochart And Investment
Exports Increasing Shows International Selling And Exportation
Juggling Percent Sign With 3d Man Climbing Showing Percentage
Stock Market Chart
Stock market graph
3D Chart
Graph and hand
Blank Paper And Calculator Shows Calculating Copyspace Statistics
Random Numbers