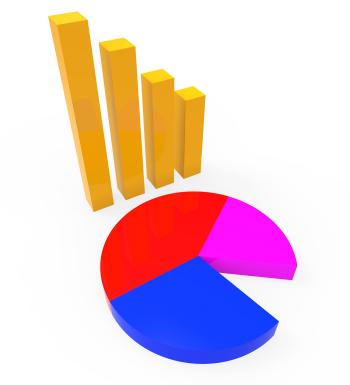
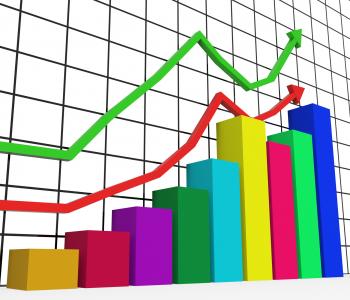
Profits Graph Shows Earn Investment And Diagram
Pie Chart Indicates Stat Graphics And Infochart
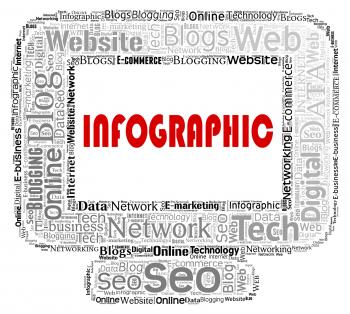
Infographic Computer Indicates Infographics Online And Statistics
Graph Report Shows Graphs Charts And Infochart
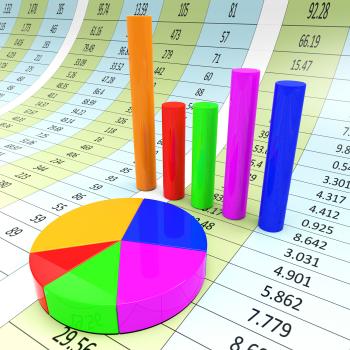
Pie Chart Indicates Financial Report And Charts
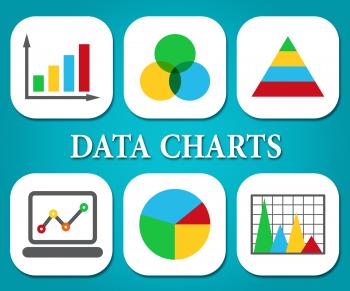
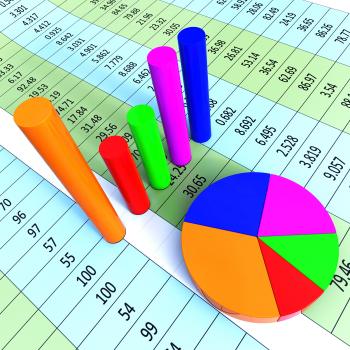
Data Charts Indicates Business Graph And Bytes
Pie Chart Report Indicates Business Graph And Document
Reports Dice Represent Reported Information or Articles
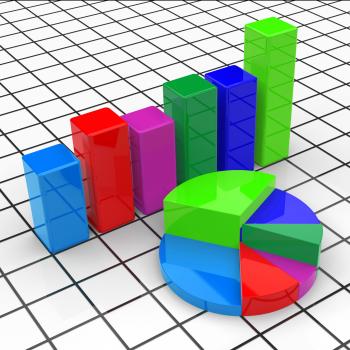
Pie Chart Report Represents Business Graph And Diagram
Stats Puzzle Shows Statistics Reports Or Analysis
Prices Increase Represents Financial Report And Diagram
Big Discount Indicates Cut Rate And Data
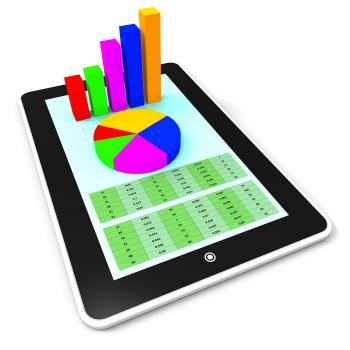
Arrow Pointing Up On Smartphone Showing Progression Report
Percent Sign With 3d Man Shows Percentage Or Discount
Businessmen parachuting on Manhattan
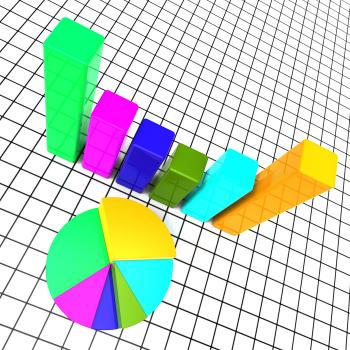
Analyzing a Pie Chart
Graph Report Shows Infograph Finance And Graphic
Info Dice Show Facts Data And Details
Statistics Data Indicates Stats Bytes And Reports
Revenues Charts Represents Business Graph And Salary
Beating the Street - Or how to make money in stocks
Graph Report Indicates Diagram Charts And Analysis
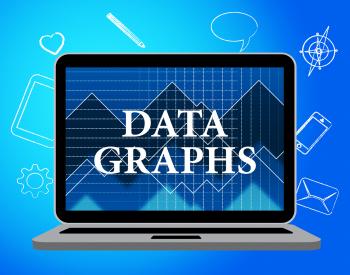
Data Graphs Means Statistical Diagram And Bytes
Concept of Search Engine Optimization
Concept of Search Engine Optimization with SEO icons
The search for profit when markets are volatile
Pen on paper with red arrows - Office work concept
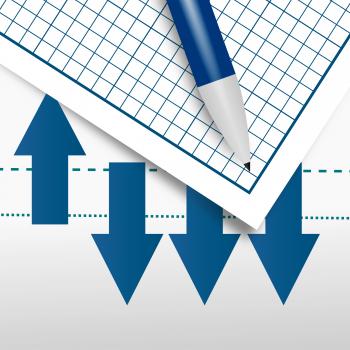
Pen on paper with blue arrows - Office work concept
Property Report Indicates Business Graph And House
Cancer Graph Indicates Cancerous Growth And Diagram
Pie Chart And 3d Characters Represents Statistics Report
Arrow Pointing Up On Screen Showing Positive Results
Big Data Analytics
Call to action using social networks
Web analytics concept - Multicolor version
Web analytics concept with data icons
Online content marketing and web analytics concept
ata Analytics Concept
Cute Little Girl Raising Finger
Cute Little Girl Showing Thumbs Up - Creativity and Great Ideas
Pie Chart Report Means Data Reports And Graph
Improve Graph Indicates Improvement Plan And Data
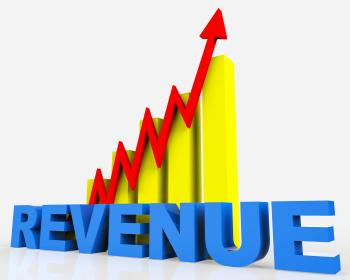
Increase Revenue Represents Business Graph And Advancing
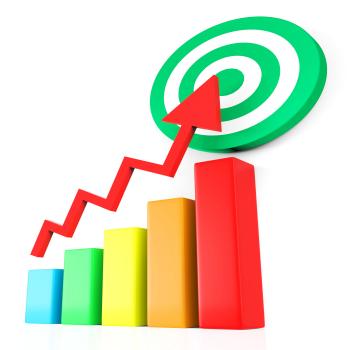
Target Report Represents Business Graph And Analysis
Graph Report Represents Trade Corporate And Finance
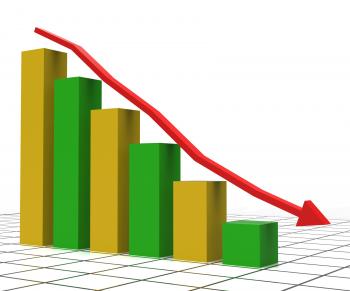
Decreasing Report Shows Graphic Analysis And Graphs
Online Report Represents World Wide Web And Computing
Graph Increasing Indicates Growth Statistics And Increase
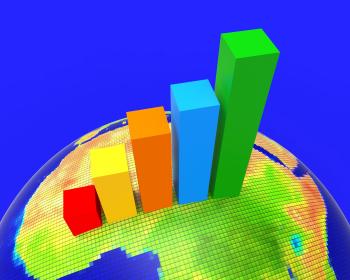
Africa Graph Indicates Financial Report And Analysis
business man at work