Decreasing Report Represents Business Graph And Decrease
Graph Report Indicates Business Statistic And Diagram
Finance Professional - Broker - Financial Advisor - Analyst
Finance Professional - Broker - Financial Advisor
Report Graph Represents Infograph Diagram And Financial
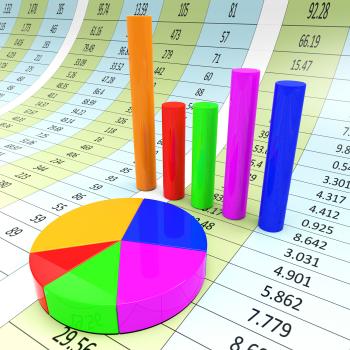
Pie Chart Shows Business Graph And Charting
Blue Arrows Background Means Graph Upwards And Growth
Success Graph Means Winner Resolution And Winning
Business Graph Means Infochart Diagram And Statistic
Investment Rates Represents Invested Percent And Percentage
Data Charts Represents Web Site And Facts
Progress Arrows Represents Business Graph And Advance
Financial Charts Shows Business Graph And Banking
Investment Guide Indicates Business Graph And Advise
Economy Graph Indicates Micro Economics And Charts
Cash Flow Graph Represents Investment Earn And Wage
Graph Earn Represents Graphics Salaries And Income
Downturn Graph Represents Market Chart And Loss 3d Rendering
Budget Graph Means Costing Expenditure And Statistic
Graph Increasing Shows Financial Report And Advance
Risk Graph Shows Infochart Beware And Risky
Business Graph Indicates Diagram Infochart And Profit
Investment Charts Shows Business Graph And Forecast
Profits Graph Shows Earn Investment And Diagram
Pie Chart Indicates Stat Graphics And Infochart
Graph Report Shows Graphs Charts And Infochart
Pie Chart Indicates Financial Report And Charts
Data Charts Indicates Business Graph And Bytes
Pie Chart Report Indicates Business Graph And Document
Pie Chart Report Represents Business Graph And Diagram
Prices Increase Represents Financial Report And Diagram
Big Discount Indicates Cut Rate And Data
Graph Report Shows Infograph Finance And Graphic
Revenues Charts Represents Business Graph And Salary
Graph Report Indicates Diagram Charts And Analysis