Dollar bill with financial graph superimposed
Thought and Execution - Business and Cognitive Concept with Arrows and
Marketing Strategy Concept
Close-up of a Cable Car
Money and Financial Data
Network of People - Brain Wired to Be Social - Dark Version
Prices Increase Represents Financial Report And Diagram
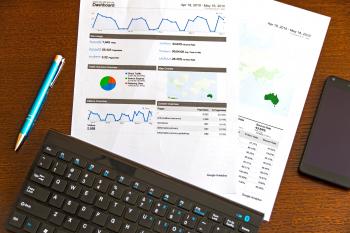
Online content marketing and web analytics concept
Graph Report Shows Infograph Finance And Graphic
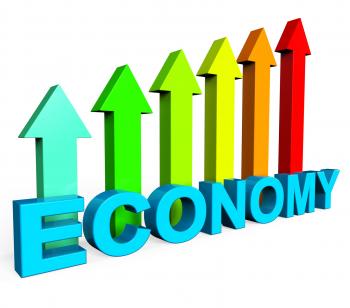
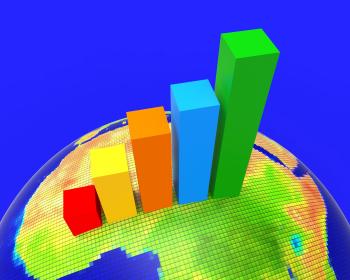
Improve Economy Shows Business Graph And Advance
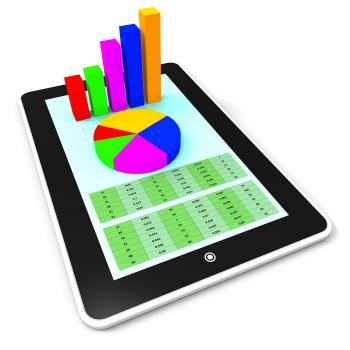
Financial Technology Concept
Antique 1905 Photo Postcard
Business and Finance - Money and Financial Newspaper
City of London with Financial Graph
Colorful Balls Background Shows Rainbow Circles And Grid
Profit Graph Shows Lucrative Incomes And Profits
Online Report Represents World Wide Web And Computing
Euros and British Pounds - Finance Concept - Brexit
Person Writing On Notebook
Sound Wave Background Shows Equalizer Or Amplifier
Graph Report Represents Trade Corporate And Finance
Finance graph on Manhattan at night
Search and Analytics Idea - With Copyspace
Hand assembling jigsaw on virtual screen
People at a Public Place - Social Beings - Colorized Faded Looks
Victorian Trade Card - Gardening Girl
Success Graph Means Winner Resolution And Winning
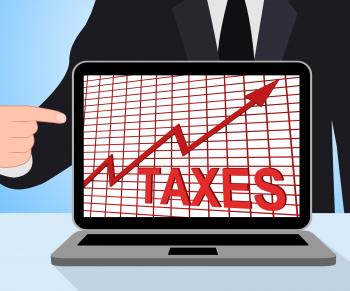
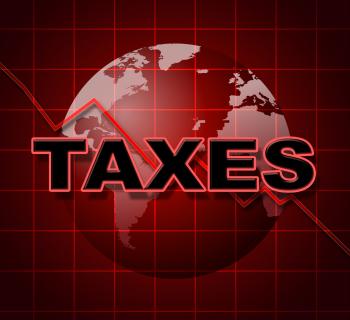
Taxes Chart Graph Displays Increasing Tax Or Taxation
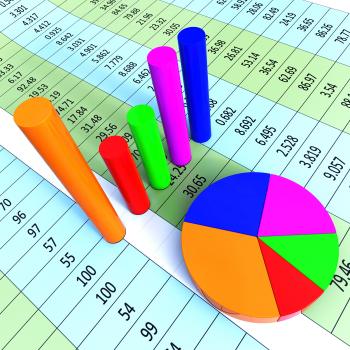
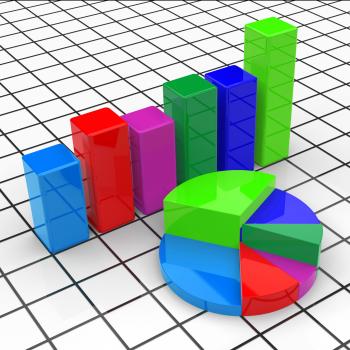
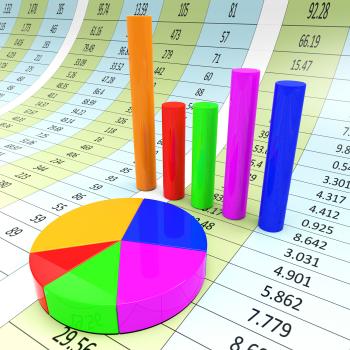
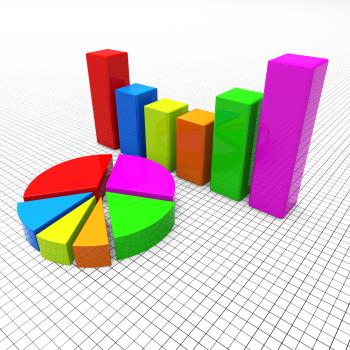
Pie Chart Report Represents Business Graph And Diagram
Concept
Graph Report Indicates Diagram Charts And Analysis
Network - Cloud Computing - Inverted
Pie Chart Shows Business Graph And Charting
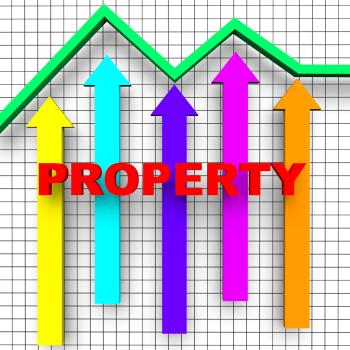
Property Report Indicates Business Graph And House
Blue Click Pen Near White Document Papers on Top of Brown Wooden Table
Africa Graph Indicates Financial Report And Analysis
Ethereum and Bitcoin Emblems
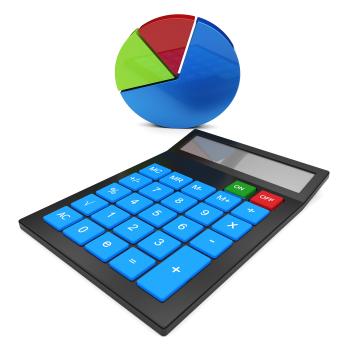
Calculate Statistics Shows Calculated Data And Statistical
Graphical Notes
Person Pointing On Paper
Marketing Strategy Concept with Copyspace
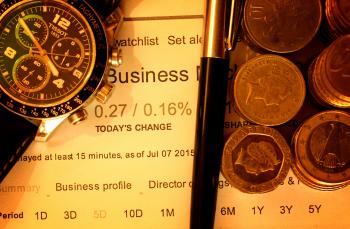
Money with pen and watch
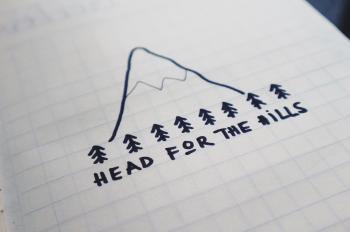
Mountain Illustration
Pen on diagram
Paper Beside Macbook
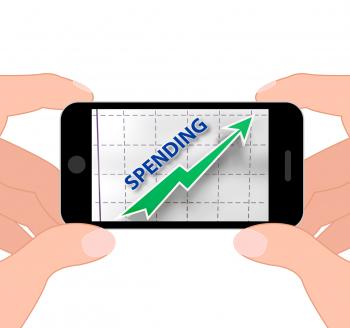
Spending Graph Displays Rise In Outgoings And Costs
Antique Christmas Card
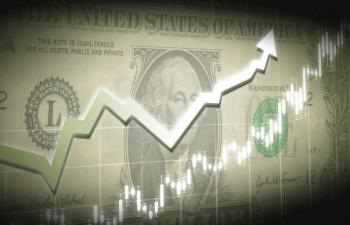
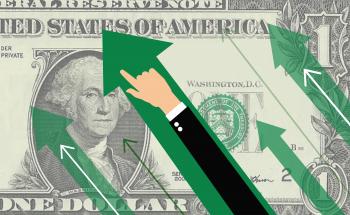
The incredible mighty dollar
Sound Wave Background Shows Sound Technology Or Audio Graphic
Euro banknotes with jumping arrow
Taxes Graph Means Duty Statistical And Infograph
Pie Chart Report Means Data Reports And Graph
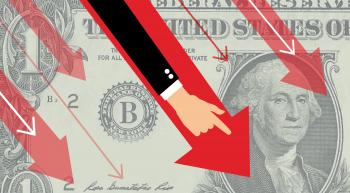
The incredible shrinking dollar
Teacher and formulas
Blue Graph Shows Sales Or Profit
Business Report Shows Financial Infochart And Graphs
SEO - Search Engine Optimization concept
Female hand writing on a paper
Pie Graph Illustration
Arrow and australian banknotes staircase
Riches Chart Graph Shows Increase Cash Wealth Revenue
Graph Report Indicates Business Statistic And Diagram
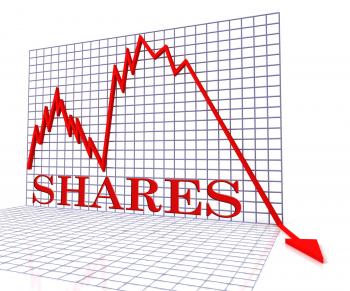
Shares Graph Negative Represents Exchange Funds 3d Rendering
Marketing Strategy Concept - With Copyspace
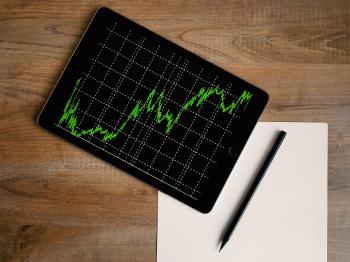
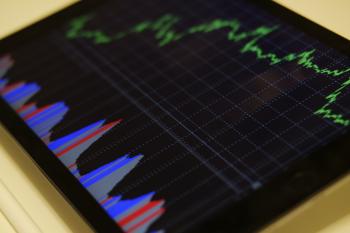
Space Grey Ipad Air With Graph on Brown Wooden Table
Arrows Spikes Background Means Graph Visual And Information
Commerce Graph Represents Ecommerce Trade And Forecast
Pulse Trace
Black Graphing Paper
Low Angle View of Lighting Equipment on Shelf
Graph and hand
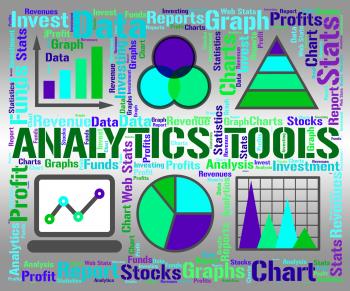
Analytics Tools Represents Business Graph And App
Blue and Yellow Graph on Stock Market Monitor
Reports Charts Shows Business Graph And Data
Arrow and british banknotes staircase
Arrows Background Means Graph And Displaying Information
Pie Chart Online Represents Financial Report And Web
Sunflowers with dollar bills
Beating the Street - Or how to make money in stocks
Growth Graph Means Financial Increase Or Gain
SEO Chart Graph Shows Increase Search Engine Optimization
Black Blue and Red Graph Illustration
Business Graph
Network of People - Brain Wired to Be Social
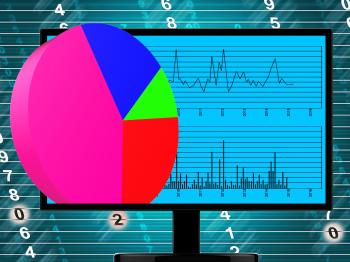
Reports Sphere Definition Means Statistical Diagram Or Company Financi
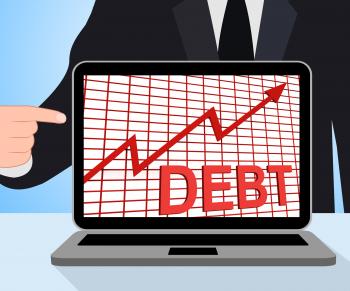
Debt Graph Chart Displays Increasing Financial Indebted
Business Graph Means Infochart Diagram And Statistic
Green Bike
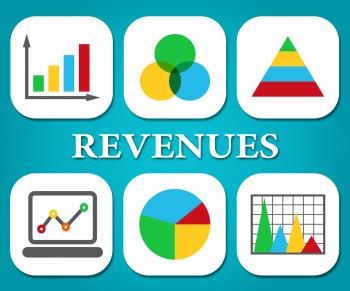
Revenues Charts Represents Business Graph And Salary
Big Discount Indicates Cut Rate And Data
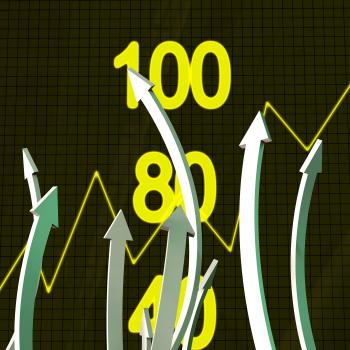
Progress Arrows Represents Business Graph And Advance