Flow Diagram Indicates Flowchart Schematic And Structure
Accounting Graph Shows Paying Taxes And Accounts
Graph Audit Indicates Auditing Infograph And Scrutiny
Analytics Tools Represents Business Graph And App
Analytics Charts Represents Business Graph And Statistics
Taxes Graph Means Duty Statistical And Infograph
Commerce Graph Represents Ecommerce Trade And Forecast
Pie Chart Online Represents Financial Report And Web
Daily Thoughts - A Man Thinking - Concept
Thought and Execution - Business and Cognitive Concept with Arrows and
Environmental Inputs to the Brain - Perception Concept
Increase Graph Represents Text Space And Copy
Raising Investment Chart Shows Progression
Arrows Pointing Up
Statistics and Trends - Upward Trend - Abstract Image
Red Right Arrow Ahead Shows Growth
Earnings Graph Shows Company Sales And Income
Reports Sphere Definition Means Statistical Diagram Or Company Financi
Reports Charts Shows Business Graph And Data
Heartbeat Chart Shows Flat Screen And Cardiograph
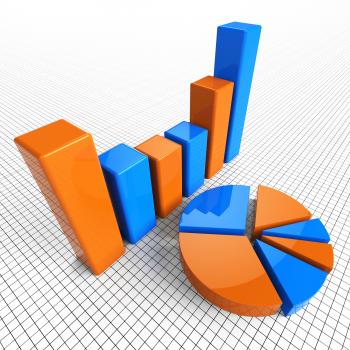
Pie Chart Shows Business Graph And Charting
Calculate Statistics Shows Calculated Data And Statistical
Businessman Increase Shows Success Successful And Progress 3d Renderin
Growth Graph Chart Displays Increase Sales Profit
Raising Profits Chart Showing Business Success
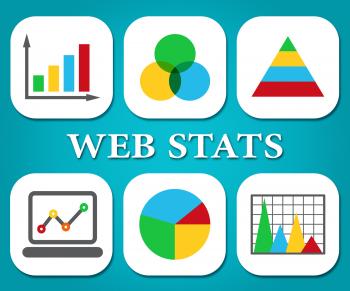
Web Stats Indicates Business Graph And Analysing
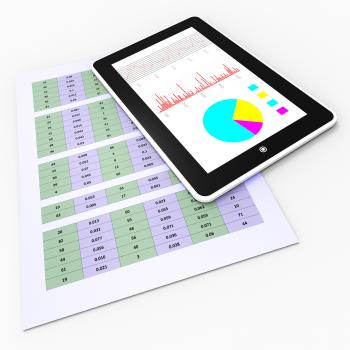
Online Reports Means Tablet Pc And Charting
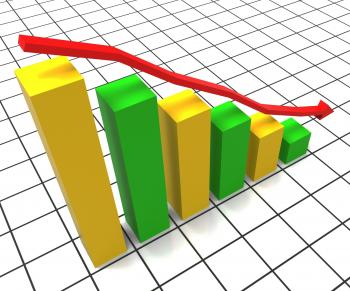
Decreasing Report Represents Business Graph And Decrease
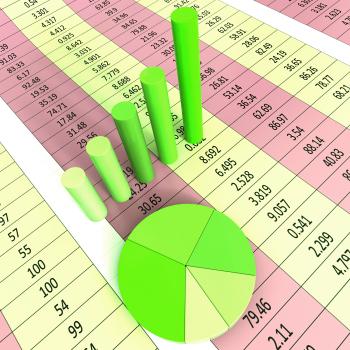
2016 Green Bar Chart Shows Budget
Graph Report Indicates Business Statistic And Diagram
Economy Graph Means National Or International Finances
Finance Professional - Broker - Financial Advisor - Analyst
Finance Professional - Broker - Financial Advisor
A Network of People - Business People - Abstract Illustration
Careers - Different Career Paths - Being On the Fast Track
Network of People - Brain Wired to Be Social - Blue Mesh
Abstract Network of People - Social Networks - Blue Background
Dynamic Arrows Moving Upward
Dynamic Arrows Moving Upward - Inverted Version
Network of People - Brain Wired to Be Social - Dark Version
Network of People - Brain Wired to Be Social
Abstract Network of People - Social Networks
Raising Profits Chart Shows Balance Progress
Report Graph Represents Infograph Diagram And Financial
Savings Increasing Indicates Financial Report And Advance
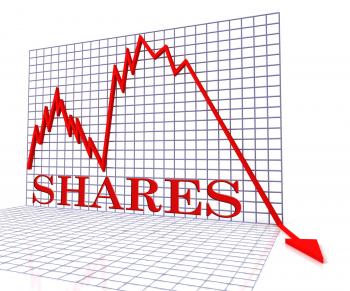
Shares Graph Negative Represents Exchange Funds 3d Rendering
Success Graph Means Winner Resolution And Winning
Markets Graph Negative Indicates Investments Down 3d Rendering
Network - Cloud Computing
Network - Cloud Computing - Inverted
Save Chart Graph Displays Increasing Savings Investment
Line Over Bar Chart Shows Profit Follows Budget
Blue Graph Shows Sales Or Profit
Earn Graph Chart Shows Increase Earnings Growing
Business Graph Means Infochart Diagram And Statistic
Investment Rates Represents Invested Percent And Percentage
Sound Wave Background Shows Sound Technology Or Audio Graphic
Red Twisting Background Means Colorful Wavy And Graph
Improve Economy Shows Business Graph And Advance
Data Charts Represents Web Site And Facts
Progress Arrows Represents Business Graph And Advance
Sound Wave Background Means Audio Amplifier Or Music Mixer
Credit Graph Chart Displays Buy Increase Grow Debt
Spending Graph Displays Rise In Outgoings And Costs
Sales Chart Graph Displays Increasing Profits Trade
Sound Wave Background Shows Equalizer Or Amplifier
Forex Graph Means Foreign Currency And Exchange
Sound Wave Background Shows Audio Spectrum Or Energy
Financial Charts Shows Business Graph And Banking
Salary Chart Graph Displays Increase Earn Cash Wealth Revenue
Investment Guide Indicates Business Graph And Advise
Economy Graph Indicates Micro Economics And Charts
Cash Flow Graph Represents Investment Earn And Wage
Graph Earn Represents Graphics Salaries And Income
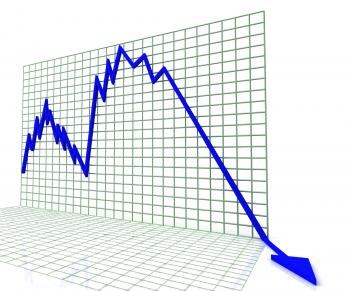
Downturn Graph Represents Market Chart And Loss 3d Rendering
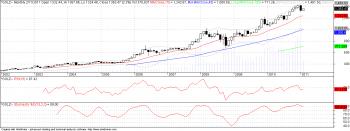
Gold - 11-2-2011
Budget Graph Means Costing Expenditure And Statistic
Bonus Chart Graph Displays Increase Reward Or Perk
Graph Increasing Shows Financial Report And Advance
Sound Wave Background Means Music Volume Or Amplifier
Risk Graph Shows Infochart Beware And Risky
Business Graph Indicates Diagram Infochart And Profit
Red Left Arrow Ahead Shows Growth
Investment Charts Shows Business Graph And Forecast
Earnings Graph Negative Indicates Wage Crisis 3d Rendering
Profits Graph Shows Earn Investment And Diagram
Spending Chart Graph Shows Increasing Expenditure Purchasing
Green Arrows Background Shows Direction Towards Right
Colorful Balls Background Shows Rainbow Circles And Grid
Pie Chart Indicates Stat Graphics And Infochart
Riches Chart Graph Shows Increase Cash Wealth Revenue
Infographic Computer Indicates Infographics Online And Statistics
Graph Report Shows Graphs Charts And Infochart
Save Graph Means More Discounts Specials And Bargains
Pie Chart Indicates Financial Report And Charts
Data Charts Indicates Business Graph And Bytes