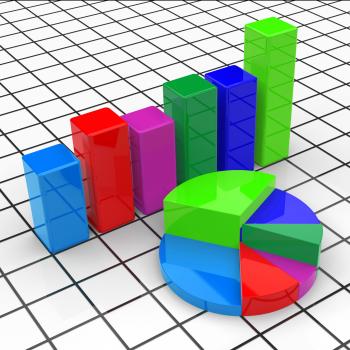
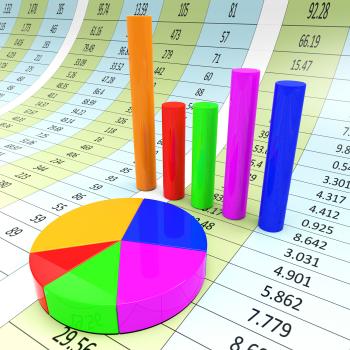
Pie Chart Report Indicates Business Graph And Document
Sound Wave Background Shows Audio Analyzer Or Audio Frequency
Spending Chart Graph Shows Increasing Expenditure Purchasing
Pie Chart Report Represents Business Graph And Diagram
Graph On Screen Shows Increase Sales Achievement
Profit Graph Shows Sales Revenue And Return
Arrows Spikes Background Means Graph Visual And Information
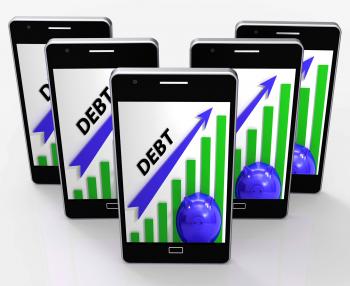
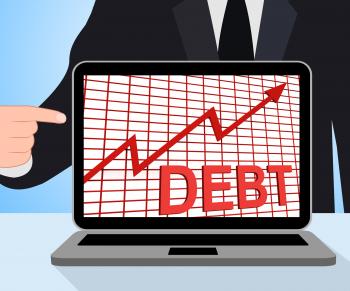
Debt Graph Shows Bills Deficit And Borrowing
Bonus Graph Displays Higher Premiums And Rewards
Antique Valentine's Day Card
Antique Patriotic Thanksgiving Card
Prices Increase Represents Financial Report And Diagram
Big Discount Indicates Cut Rate And Data
Cash Graph Shows Money Earnings And Savings
SEO Chart Graph Shows Increase Search Engine Optimization
Debt Graph Chart Displays Increasing Financial Indebted
Sunflowers with dollar bills
Study and Knowledge Concept
Finance graph superimposed on Manhattan
Finance graph on Manhattan at night
Simple Connected Cloud
Digital Cloud Concept with Lightning
Simple Digital Cloud Concept
City of London with Financial Graph
Analyzing a Pie Chart
Graph Report Shows Infograph Finance And Graphic
Credit Graph Means Financing Lending And Repayments
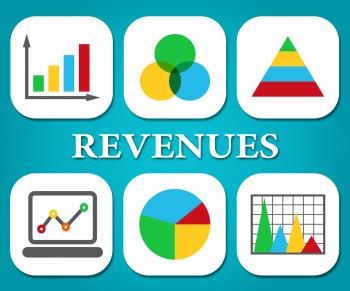
Revenues Charts Represents Business Graph And Salary
Sound Wave Background Means Energy Graphic Or Beats Frequency
Arrows Background Means Graph And Displaying Information
Sound Wave Background Means Audio Frequency Or Analyzer
The incredible shrinking dollar
The incredible mighty dollar
Beating the Street - Or how to make money in stocks
Cloud storage concept
Graph Report Indicates Diagram Charts And Analysis
Heartbeat Tablet Means Pulse Trace And Cardiology
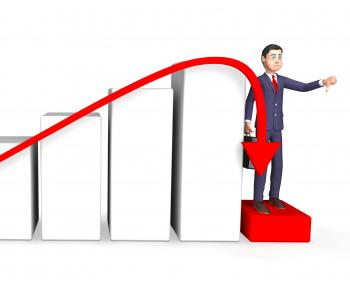
Debt Businessman Shows Lack Of Success And Accounting 3d Rendering
Data Graphs Means Statistical Diagram And Bytes
Sketch of people in a social network
The search for profit when markets are volatile
Bonus Graph Phone Shows Incentives Rewards And Premiums
Internet of Things concept - everything is connected in the new world
Internet of Things II - Multicolor version
Internet of Things concept - Globalized interconnected world
Pen on paper with red arrows - Office work concept
Pen on paper with blue arrows - Office work concept
Money with financial graph - Money and markets concept
Money in a pile of coins with financial graph
Property Report Indicates Business Graph And House
Cancer Graph Indicates Cancerous Growth And Diagram
The Stock Market Game - Bulls and Bears
Gbp Graph Negative Shows British Pound 3d Rendering
Purple Spikes Background Means Peaks And Jagged Lines
Flow Diagram Represents Charting Organizations And Graph
Budget Graph Negative Shows Budgeting Decline 3d Rendering
Sound Wave Background Means Audio Mixer Or Beats Pattern
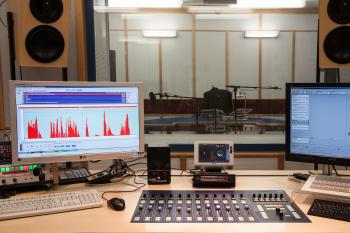
Sound Studio
SEO - Search Engine Optimization concept
Internet of Things concept - Laptop with Information Technology icons
Internet of Things concept - Tablet with Information Technology icons
Web analytics concept - Multicolor version
Web analytics concept with data icons
Online content marketing and web analytics concept
ata Analytics Concept
Vintage Christmas Card
Antique Christmas Card
Child Learning On-Line
Happy child drawing a sunny landscape
Pie Chart Report Means Data Reports And Graph
Improve Graph Indicates Improvement Plan And Data
Bull versus Bear
Equity markets - Bull versus Bear concept
Bear Market - Markets are Falling
Bull Market - Markets are Climbing
Increase Revenue Represents Business Graph And Advancing
Target Report Represents Business Graph And Analysis
Taxes Chart Graph Displays Increasing Tax Or Taxation
Business Report Shows Financial Infochart And Graphs
Growth File Represents Business Graph And Binder 3d Rendering
Graph Report Represents Trade Corporate And Finance
Decreasing Report Shows Graphic Analysis And Graphs
Profits Businessman Means Winner Victory And Earning 3d Rendering
Health Heartbeat Represents Wellness Sprint And Render 3d Rendering
Online Report Represents World Wide Web And Computing
Raising Stocks Chart Shows Monetary Growth
Blue Bar Chart Shows Increased Profit
Graph Increasing Indicates Growth Statistics And Increase
Africa Graph Indicates Financial Report And Analysis
Profit Graph Shows Lucrative Incomes And Profits
Growth Graph Means Financial Increase Or Gain