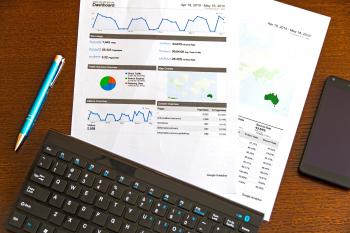
Blue Click Pen Near White Document Papers on Top of Brown Wooden Table
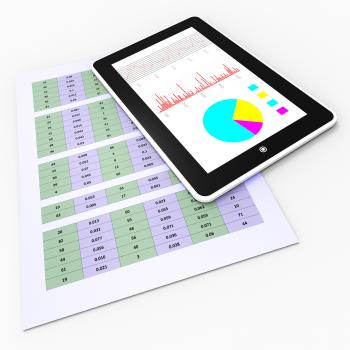
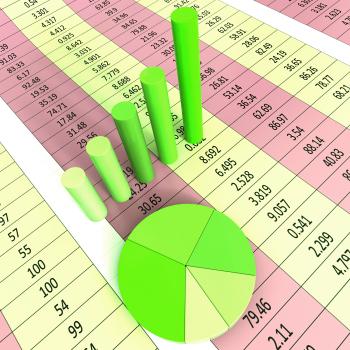
Pie Chart Indicates Financial Report And Charts
Macbook Pro Beside Papers
Female hand writing on a paper
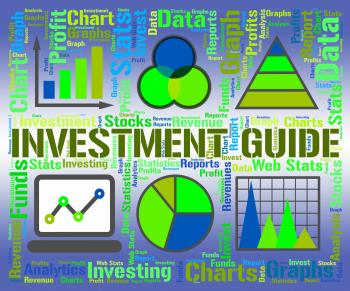
Investment Guide Indicates Business Graph And Advise
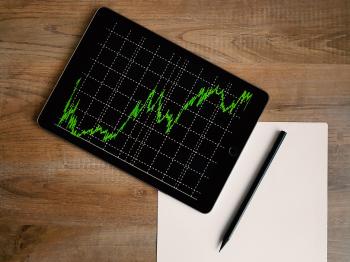
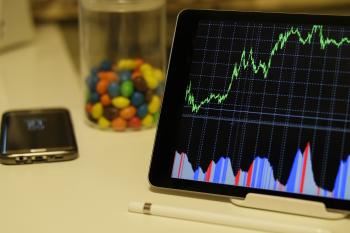
Space Grey Ipad Air With Graph on Brown Wooden Table
Business Graph Indicates Diagram Infochart And Profit
Online Reports Means Tablet Pc And Charting
White Android Tablet Turned on Displaying a Graph
Spending Chart Graph Shows Increasing Expenditure Purchasing
Person Holding Blue Ballpoint Pen On White Notebook
Bonus Graph Phone Shows Incentives Rewards And Premiums
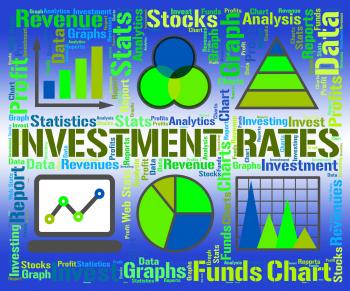
Investment Rates Represents Invested Percent And Percentage
Purple Spikes Background Means Peaks And Jagged Lines
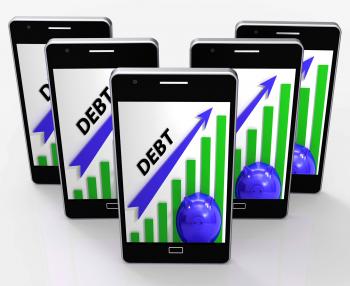
Debt Graph Shows Bills Deficit And Borrowing
Red Twisting Background Means Colorful Wavy And Graph
Data Graphs Means Statistical Diagram And Bytes
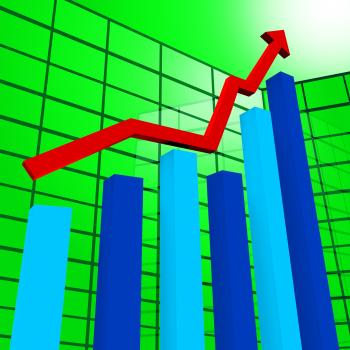
Profit Graph Shows Sales Revenue And Return
Sales Chart Graph Displays Increasing Profits Trade
Report Graph Represents Infograph Diagram And Financial
Green Arrows Background Shows Direction Towards Right
Round Gray Steel Ornament
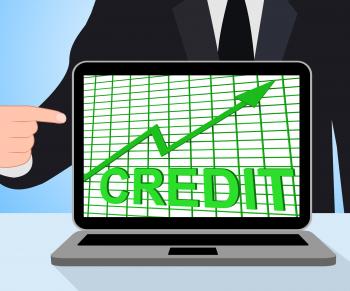
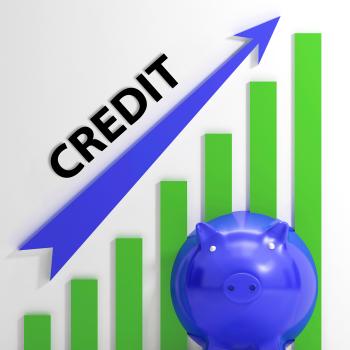
Credit Graph Chart Displays Buy Increase Grow Debt
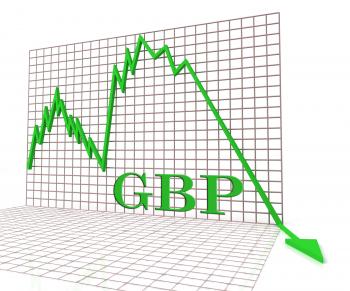
Gbp Graph Negative Shows British Pound 3d Rendering
Infographic Computer Indicates Infographics Online And Statistics
Credit Graph Means Financing Lending And Repayments
Earn Graph Chart Shows Increase Earnings Growing
Low Angle View of Lighting Equipment on Shelf
Pie Chart Report Indicates Business Graph And Document
Raising Profits Chart Showing Business Success
Cash Graph Shows Money Earnings And Savings