Pie Chart Indicates Stat Graphics And Infochart
Twenty Nineteen Represents 2019 New Year 3d Illustration
Twenty Eighteen Blocks Represents Happy New Year And Kids
Profits Graph Shows Earn Investment And Diagram
Australia Weather Indicates Meteorological Conditions And Forecast
Earnings Graph Negative Indicates Wage Crisis 3d Rendering
Investment Charts Shows Business Graph And Forecast
Red Left Arrow Ahead Shows Growth
Risk Graph Shows Infochart Beware And Risky
Sun Rain Computer Mean Weather And Seasons
Graph Increasing Shows Financial Report And Advance
Budget Graph Means Costing Expenditure And Statistic
Downturn Graph Represents Market Chart And Loss 3d Rendering
Local Weather Means City Or Town Forecast
Graph Earn Represents Graphics Salaries And Income
Cash Flow Graph Represents Investment Earn And Wage
Economy Graph Indicates Micro Economics And Charts
Investment Guide Indicates Business Graph And Advise
Financial Charts Shows Business Graph And Banking
Weather Forecast Indicates Meteorological Conditions And Forecaster
Investment Rates Represents Invested Percent And Percentage
New Year Shows Two Thousand Eighteen And Celebrate
Business Graph Means Infochart Diagram And Statistic
New Year Shows Two Thousand Eighteen And Annual
Markets Graph Negative Indicates Investments Down 3d Rendering
Success Graph Means Winner Resolution And Winning
New Year Represents Two Thousand Nineteen And Annual
Weather Forecast Indicates Meteorological Conditions And Forecasting
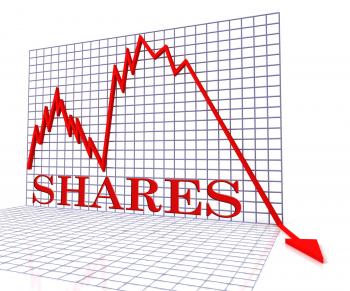
Shares Graph Negative Represents Exchange Funds 3d Rendering
Past Present And Future Keys Show Evolution Or Aging
Savings Increasing Indicates Financial Report And Advance
Two Thosand Twenty Represents New Year And Children
Web Stats Indicates Business Graph And Analysing
Sun Rain Signpost Displays Weather Forecast Sunny or Raining
Credit Graph Indicates Finance And Loan Diagram
Pie Chart Shows Business Graph And Charting